Stock Market Outlook for October 18, 2024

The largest September decline in Retail Sales in five years highlights a consumer that is pulling back.
*** Stocks highlighted are for information purposes only and should not be considered as advice to purchase or to sell mentioned securities. As always, the use of technical and fundamental analysis is encouraged in order to fine tune entry and exit points to average seasonal trends.
Stocks Entering Period of Seasonal Strength Today:
Subscribers Click on the relevant link to view the full profile. Not a subscriber? Signup here.

Mammoth Energy Services, Inc. (NASD:TUSK) Seasonal Chart

Stellantis N.V. (NYSE:STLA) Seasonal Chart

Vanguard U.S. Dividend Appreciation Index ETF (TSE:VGG.TO) Seasonal Chart

Microchip Technology Inc. (NASD:MCHP) Seasonal Chart

Audiovox Corp. (NASD:VOXX) Seasonal Chart

Cleveland-Cliffs Inc (NYSE:CLF) Seasonal Chart

CPI Aerostructures, Inc. (NYSE:CVU) Seasonal Chart

Motorcar Parts of America Inc. (NASD:MPAA) Seasonal Chart
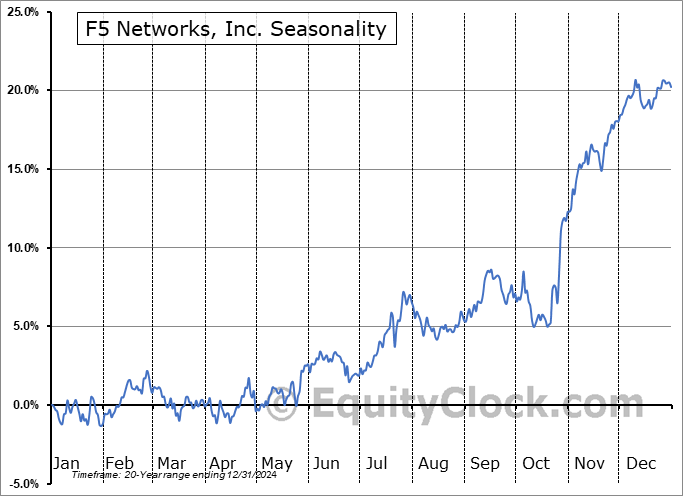
F5 Networks, Inc. (NASD:FFIV) Seasonal Chart
The Markets
Stocks ended close to the flatline as strength in the technology, energy, and financial sectors failed to keep S&P 500 Index in the green by the closing bell. The S&P 500 Index closed down by a mere two basis points (0.02%), charting a bit of a reversal candlestick around the all-time high. Support continues to be pinned at previous resistance of 5669, along with the 20-day moving average that is hovering around 5759. Despite evidence of waning upside momentum within this tail-end to the period of seasonal volatility for stocks, this market is showing greater evidence of support than resistance, a characteristic of a bullish trend. We continue to like the groups that are on our growing list of Accumulate candidates, but there are certainly segments of the market to Avoid. The ability of the market, as a whole, to overcome the period of seasonal weakness for stocks rather unscathed is certainly telling of the relentless demand that has supported the benchmark, despite the fact that the risk-reward, broadly, is not very attractive. The start of the best six months of the year for stocks is just a couple of weeks away and there is a need from a seasonal perspective to ramp up risk exposure at some point.

Today, in our Market Outlook to subscribers, we discuss the following:
- US Retail Sales
- Retailer Inventories
- Visa Spending Momentum Index
- Consumer Discretionary Sector
- Weekly Jobless Claims and the health of the labor market
Subscribers can look for this report in their inbox or by clicking on the following link and logging in: Market Outlook for October 18
Not signed up yet? Subscribe now to receive full access to all of the research and analysis that we publish.
Sentiment on Thursday, as gauged by the put-call ratio, ended close to neutral at 0.98.

Seasonal charts of companies reporting earnings today:


S&P 500 Index


TSE Composite


| Sponsored By... |

|


