Stock Market Outlook for October 21, 2024

The trend of Industrial Production this year points to a Republican win for the office of the President.
*** Stocks highlighted are for information purposes only and should not be considered as advice to purchase or to sell mentioned securities. As always, the use of technical and fundamental analysis is encouraged in order to fine tune entry and exit points to average seasonal trends.
Stocks Entering Period of Seasonal Strength Today:
Subscribers Click on the relevant link to view the full profile. Not a subscriber? Signup here.
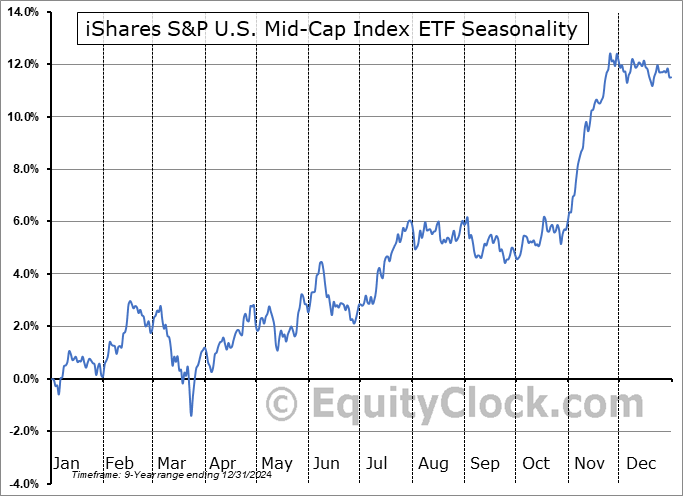
iShares S&P U.S. Mid-Cap Index ETF (TSE:XMC.TO) Seasonal Chart
West Fraser Timber Co. Ltd. (TSE:WFG.TO) Seasonal Chart
Energy Fuels, Inc. (TSE:EFR.TO) Seasonal Chart
VanEck Vectors Semiconductor ETF (NASD:SMH) Seasonal Chart
Carnival Plc. (NYSE:CUK) Seasonal Chart
Floor & Decor Holdings, Inc. (NYSE:FND) Seasonal Chart
Invesco S&P SmallCap Information Technology ETF (NASD:PSCT) Seasonal Chart
Trane Technologies Inc (NYSE:TT) Seasonal Chart
Coty Inc. (NYSE:COTY) Seasonal Chart
Autoliv, Inc. (NYSE:ALV) Seasonal Chart
Zebra Technologies Corp. (NASD:ZBRA) Seasonal Chart
Las Vegas Sands Corp. (NYSE:LVS) Seasonal Chart
Honeywell International, Inc. (NASD:HON) Seasonal Chart
Ford Motor Co. (NYSE:F) Seasonal Chart
Autozone Inc. Nevada (NYSE:AZO) Seasonal Chart
Science Applications International Corp. (NYSE:SAIC) Seasonal Chart
Invesco Dynamic Semiconductors ETF (NYSE:PSI) Seasonal Chart
Invesco S&P SmallCap Consumer Discretionary ETF (NASD:PSCD) Seasonal Chart
Badger Meter, Inc. (NYSE:BMI) Seasonal Chart
Fastenal Co. (NASD:FAST) Seasonal Chart
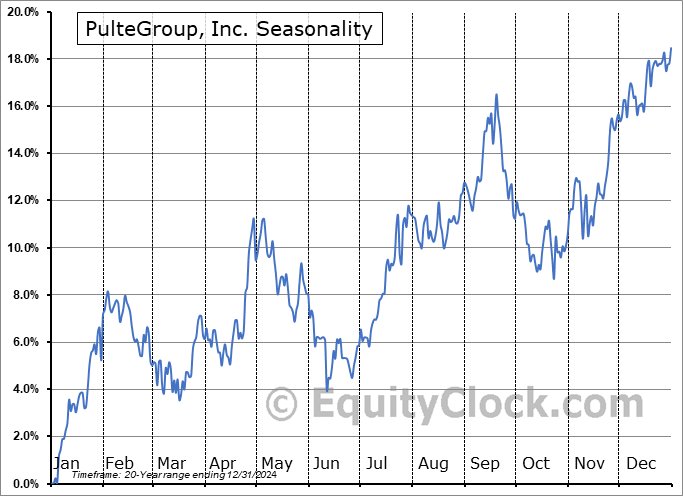
PulteGroup, Inc. (NYSE:PHM) Seasonal Chart
Lennox Intl Inc. (NYSE:LII) Seasonal Chart
Buckle, Inc. (NYSE:BKE) Seasonal Chart
Boeing Co. (NYSE:BA) Seasonal Chart
Manitowoc Co, Inc. (NYSE:MTW) Seasonal Chart
The Markets
Stocks continued to receive lift from positive reaction to corporate earnings on Friday, pushing the large-cap benchmark back to short-term resistance at 5870. The S&P 500 Index closed higher by four-tenths of one percent, sufficient to achieve a fresh record closing high. Support continues to be pinned at previous resistance of 5669, along with the 20-day moving average that is hovering around 5767. Despite evidence of waning upside momentum within this tail-end to the period of seasonal volatility for stocks, this market is showing greater evidence of support than resistance, a characteristic of a bullish trend. We continue to like the groups that are on our growing list of Accumulate candidates, but there are certainly segments of the market to Avoid. The ability of the market, as a whole, to overcome the period of seasonal weakness for stocks rather unscathed is certainly telling of the relentless demand that has supported the benchmark, despite the fact that the risk-reward, broadly, is not very attractive. The start of the best six months of the year for stocks is just a couple of weeks away and there is a need from a seasonal perspective to ramp up risk exposure at some point.
Today, in our Market Outlook to subscribers, we discuss the following:
- Weekly look at the large-cap benchmark
- US Industrial Production and the investment implications within
- The impact of the below average trend of Industrial Production on the Presidential Election
- Mixed manufacturer sentiment
- The surge in precious metal prices last week and why we are ignoring seasonal tendencies for this market segment
Subscribers can look for this report in their inbox or by clicking on the following link and logging in: Market Outlook for October 21
Not signed up yet? Subscribe now to receive full access to all of the research and analysis that we publish.
Sentiment on Friday, as gauged by the put-call ratio, ended bullish at 0.84.
Seasonal charts of companies reporting earnings today:
S&P 500 Index
TSE Composite
| Sponsored By... |

|


