Stock Market Outlook for November 7, 2024

Running down the Election impact on markets.
*** Stocks highlighted are for information purposes only and should not be considered as advice to purchase or to sell mentioned securities. As always, the use of technical and fundamental analysis is encouraged in order to fine tune entry and exit points to average seasonal trends.
Stocks Entering Period of Seasonal Strength Today:
Subscribers Click on the relevant link to view the full profile. Not a subscriber? Signup here.
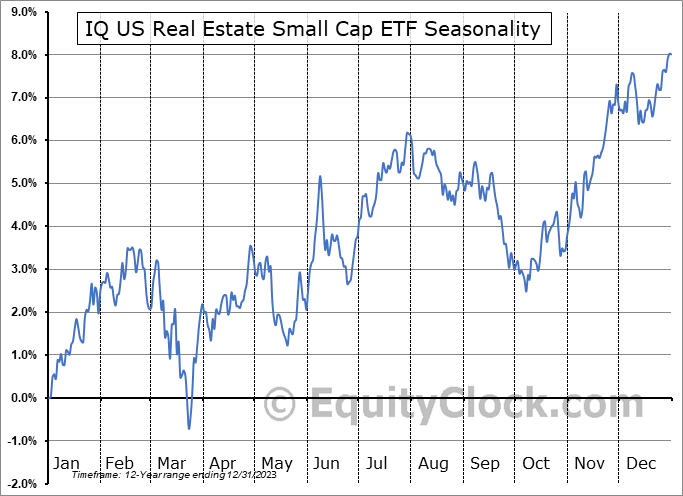
IQ US Real Estate Small Cap ETF (NYSE:ROOF) Seasonal Chart
Invesco S&P 500 Equal Weight ETF (NYSE:RSP) Seasonal Chart
Vanguard Value ETF (NYSE:VTV) Seasonal Chart
Perdoceo Education Corporation (NASD:PRDO) Seasonal Chart
Innovator S&P 500 Power Buffer ETF (AMEX:POCT) Seasonal Chart
Vanguard Growth ETF Portfolio (TSE:VGRO.TO) Seasonal Chart
Westlake Chemical Corp. (NYSE:WLK) Seasonal Chart
Vornado Realty Trust (NYSE:VNO) Seasonal Chart
Louisiana Pacific Corp. (NYSE:LPX) Seasonal Chart
Synovus Financial Corp. (NYSE:SNV) Seasonal Chart
Churchill Downs, Inc. (NASD:CHDN) Seasonal Chart
AutoCanada Inc. (TSE:ACQ.TO) Seasonal Chart
Fortinet Inc. (NASD:FTNT) Seasonal Chart
Mr. Cooper Group Inc. (NASD:COOP) Seasonal Chart
The Markets
Stocks surged on Wednesday following the outcome of the US Presidential Election that showed Americans demanding change from the repressive cost of living crisis of the past few years. The S&P 500 Index closed higher by 2.53%, gapping above resistance at the 20-day moving average (5813) after bouncing strongly in the past couple of sessions at the 50-day average (5712). The surge at the open defines a zone of support below the market between Tuesday’s close at 5783 and Wednesday’s open at 5864. On a intermediate-term scale, there remains greater evidence of support than resistance, presenting characteristics of a bullish trend that remains enticing for the strength that is normally realized in the market at year-end. The concern that has been presented to the prevailing path, however, has been the waning of upside momentum with MACD negatively diverging from price since the end of last year. The curl higher of MACD above its middle line following the rebound in the past two days reconfirms characteristics of a bullish trend. The short-term pullback realized at the end of October and into the start of November provided us with an entry point to risk exposure for the strength that is normal of the equity market through the last couple of months of the year and, today, we are topping off that exposure in the Super Simple Seasonal Portfolio to achieve the equity allocation that we desire. We continue to like how our list of candidates in the market to Accumulate and to Avoid is positioned, but we will certainly be scrutinizing whether any changes are required in the days/weeks ahead as the price action evolves.
Today, in our Market Outlook to subscribers, we discuss the following:
- The untarnished forecasting ability of the trend of industrial production to predict the presidential election
- Banks, Industrial, and Energy stocks
- The breakout of the Dow Jones Transportation Average above significant horizontal resistance
- The widening gap between consumer services and goods stocks
- Yields pressuring declining trendline resistance while yield sensitive segments of the market testing rising trendline support
- The breakdown of the Volatility Index (VIX) and the Short VIX trade
- Gold pulling back to rising trendline support
Subscribers can look for this report in their inbox or by clicking on the following link and logging in: Market Outlook for November 7
Not signed up yet? Subscribe now to receive full access to all of the research and analysis that we publish.
Sentiment on Wednesday, as gauged by the put-call ratio, ended bullish at 0.84.
Seasonal charts of companies reporting earnings today:
S&P 500 Index
TSE Composite
| Sponsored By... |

|


