Stock Market Outlook for November 13, 2024

The downfall of commodity prices suggests that inflation concerns in the market may be offside, for now.
*** Stocks highlighted are for information purposes only and should not be considered as advice to purchase or to sell mentioned securities. As always, the use of technical and fundamental analysis is encouraged in order to fine tune entry and exit points to average seasonal trends.
Stocks Entering Period of Seasonal Strength Today:
Subscribers Click on the relevant link to view the full profile. Not a subscriber? Signup here.
Howmet Aerospace Inc. (NYSE:HWM) Seasonal Chart
SPDR S&P Emerging Markets Dividend ETF (NYSE:EDIV) Seasonal Chart
iShares MSCI China ETF (NASD:MCHI) Seasonal Chart
PennantPark Investment Corp. (NYSE:PNNT) Seasonal Chart
SPDR S&P Global Dividend ETF (AMEX:WDIV) Seasonal Chart
SB Financial Group Inc. (NASD:SBFG) Seasonal Chart
Howard Hughes Corp. (NYSE:HHH) Seasonal Chart
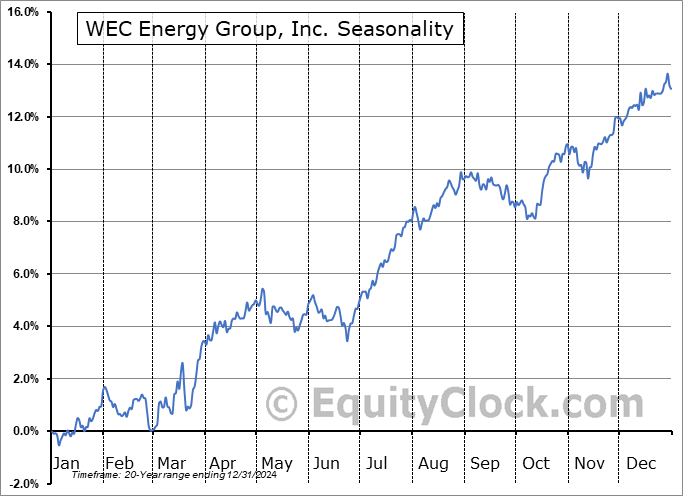
WEC Energy Group, Inc. (NYSE:WEC) Seasonal Chart
Sherritt Intl Corp. (TSE:S.TO) Seasonal Chart
Tidewater, Inc. (NYSE:TDW) Seasonal Chart
Leons Furniture Ltd. (TSE:LNF.TO) Seasonal Chart
Northland Power Inc. (TSE:NPI.TO) Seasonal Chart
Plaza Retail REIT (TSE:PLZ/UN.TO) Seasonal Chart
Winpak Ltd. (TSE:WPK.TO) Seasonal Chart
Fluor Corp. (NYSE:FLR) Seasonal Chart
Esco Technologies, Inc. (NYSE:ESE) Seasonal Chart
Mastec, Inc. (NYSE:MTZ) Seasonal Chart
High Liner Foods Inc. (TSE:HLF.TO) Seasonal Chart
The Markets
Dollar and rate headwinds took a bite out of the recent positivity in the equity market on Tuesday. The S&P 500 Index pulled back by just less than three-tenths of one percent, holding around the important psychological threshold and the year-end target of many analysts at 6000. Gap support remains unfilled between Tuesday’s close at 5783 and Wednesday’s open at 5864, a zone that still has a reasonable likelihood of being filled, to some degree, before the march higher aligned with seasonal norms continues. On a intermediate-term scale, there remains greater evidence of support than resistance, presenting characteristics of a bullish trend that remains enticing for the strength that is normally realized in the market at year-end. MACD has curled higher above its middle line following the surge in prices in recent days, reconfirming characteristics of a bullish trend. The short-term pullback realized at the end of October and into the start of November provided us with an entry point to risk exposure for the strength that is normal of the equity market through the last couple of months of the year and we are now locked into the risk exposure that we desire for this timeframe. We continue to like how our list of candidates in the market to Accumulate and to Avoid is positioned, but we are cognizant of changing market dynamics as dollar and rate headwinds grow. We will be scrutinizing whether any changes are required in the days/weeks ahead as the price action evolves.
Today, in our Market Outlook to subscribers, we discuss the following:
- The breakout of the US Dollar above declining trendline resistance
- The destabilizing force of the rise of the Dollar and the downfall of commodity prices
- The correlation of the performance of commodity prices and inflationary pressures
- The struggling performance of equities outside of the US
- Utilities and REITs sectors reaching back to intermediate-term rising trendline support
Subscribers can look for this report in their inbox or by clicking on the following link and logging in: Market Outlook for November 13
Not signed up yet? Subscribe now to receive full access to all of the research and analysis that we publish.
Sentiment on Tuesday, as gauged by the put-call ratio, ended bullish at 0.84.
Seasonal charts of companies reporting earnings today:
S&P 500 Index
TSE Composite
| Sponsored By... |

|


