Stock Market Outlook for November 21, 2024

Consumer loan activity remains depressed and this remains a burden on the housing market.
*** Stocks highlighted are for information purposes only and should not be considered as advice to purchase or to sell mentioned securities. As always, the use of technical and fundamental analysis is encouraged in order to fine tune entry and exit points to average seasonal trends.
Stocks Entering Period of Seasonal Strength Today:
Subscribers Click on the relevant link to view the full profile. Not a subscriber? Signup here.
Invesco NASDAQ Internet ETF (NASD:PNQI) Seasonal Chart
Invesco S&P 500 High Dividend Low Volatility ETF (AMEX:SPHD) Seasonal Chart
Park Hotels & Resorts Inc. (NYSE:PK) Seasonal Chart
Sangoma Technologies Corp. (TSE:STC.TO) Seasonal Chart
iShares U.S. Home Construction ETF (NYSE:ITB) Seasonal Chart
ProLogis, Inc. (NYSE:PLD) Seasonal Chart
iShares U.S. Real Estate ETF (NYSE:IYR) Seasonal Chart
Arrow Electronics Inc. (NYSE:ARW) Seasonal Chart
Dana Inc. (NYSE:DAN) Seasonal Chart
Highwoods Properties, Inc. (NYSE:HIW) Seasonal Chart
Flotek Industries Inc. (NYSE:FTK) Seasonal Chart
Sonic Automotive, Inc. (NYSE:SAH) Seasonal Chart
UFP Industries (NASD:UFPI) Seasonal Chart
SunPower Corp. (NASD:SPWR) Seasonal Chart
DaVita Inc. (NYSE:DVA) Seasonal Chart
American Superconductor Corp. (NASD:AMSC) Seasonal Chart
CBRE Group, Inc. (NYSE:CBRE) Seasonal Chart
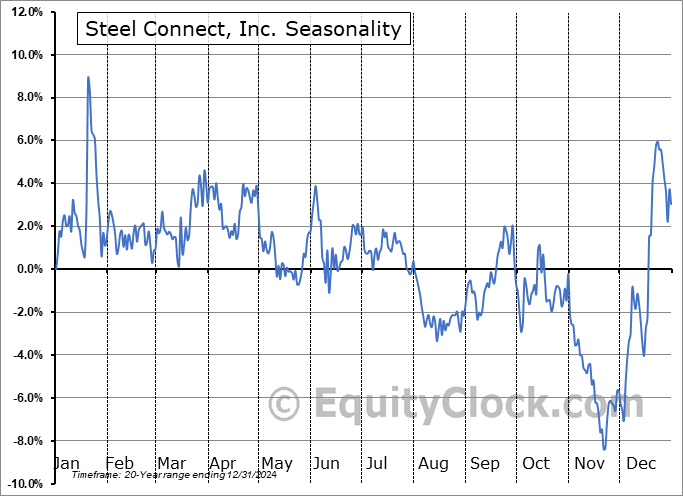
Steel Connect, Inc. (NASD:STCN) Seasonal Chart
News Corp. (NASD:NWS) Seasonal Chart
The Markets
Stocks traded around the flat-line on Wednesday as investors waited for earnings results from Tech darling NVIDA after the closing bell. The S&P 500 Index closed virtually unchanged, continuing to hold support at the 20-day moving average (5871), along with gap support that was opened around two weeks ago between 5783 and 5864, a zone that was reasonable to be filled before the march higher aligned with seasonal norms continues around the US Thanksgiving holiday, now just a week away. On a intermediate-term scale, there remains greater evidence of support than resistance, presenting the desired backdrop for strength that is normally realized in the market at year-end. Major moving averages are all pointed higher and momentum indicators continue to gyrate above their middle lines, providing characteristics of a bullish trend. We continue to like how our list of candidates in the market to Accumulate and to Avoid is positioned, but we are cognizant of changing market dynamics as revelations pertaining to Trump’s initiatives become apparent and as dollar/rate headwinds grow. We continue to scrutinize whether any changes are required as the price action evolves.
Today, in our Market Outlook to subscribers, we discuss the following:
- US Housing Starts and the seasonal trade in the home builders
- Consumer loan activity
- The strong increase in home equity loans amidst this high cost of borrowing environment
- The elevated level of delinquencies on consumer debt
- High yield spreads remain on a declining path
- Canada Consumer Price Index (CPI) and the largest percentage increase in property taxes since 1990
- The Canadian Dollar
Subscribers can look for this report in their inbox or by clicking on the following link and logging in: Market Outlook for November 21
Not signed up yet? Subscribe now to receive full access to all of the research and analysis that we publish.
Sentiment on Wednesday, as gauged by the put-call ratio, ended bullish at 0.81.
Seasonal charts of companies reporting earnings today:
S&P 500 Index
TSE Composite
| Sponsored By... |

|


