Stock Market Outlook for November 25, 2024

Stocks tend to gain during the US Thanksgiving week and the liquidity backdrop in the market is supportive of this positivity now and through year-end.
*** Stocks highlighted are for information purposes only and should not be considered as advice to purchase or to sell mentioned securities. As always, the use of technical and fundamental analysis is encouraged in order to fine tune entry and exit points to average seasonal trends.
Stocks Entering Period of Seasonal Strength Today:
Subscribers Click on the relevant link to view the full profile. Not a subscriber? Signup here.
Spirit Realty Capital, Inc. (NYSE:SRC) Seasonal Chart
ASA Gold and Precious Metals Ltd. (NYSE:ASA) Seasonal Chart
iShares Core MSCI EAFE ETF (AMEX:IEFA) Seasonal Chart
FreightCar America Inc. (NASD:RAIL) Seasonal Chart
Extra Space Storage Inc. (NYSE:EXR) Seasonal Chart
TEGNA Inc. (NYSE:TGNA) Seasonal Chart
Diodes Inc. (NASD:DIOD) Seasonal Chart
UMH Properties, Inc. (NYSE:UMH) Seasonal Chart
Cognizant Technology Solutions Corp. (NASD:CTSH) Seasonal Chart
Enghouse Systems Ltd. (TSE:ENGH.TO) Seasonal Chart
Vipshop Holdings Ltd. (NYSE:VIPS) Seasonal Chart
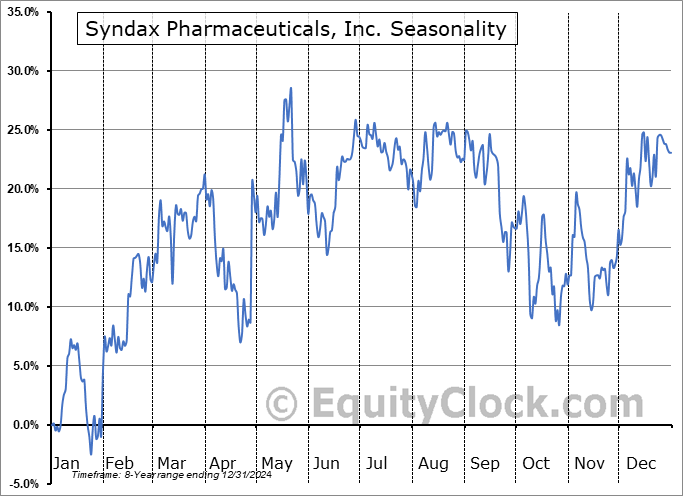
Syndax Pharmaceuticals, Inc. (NASD:SNDX) Seasonal Chart
Aura Minerals Inc. (TSE:ORA.TO) Seasonal Chart
ModivCare Inc. (NASD:MODV) Seasonal Chart
Novo Nordisk A S (NYSE:NVO) Seasonal Chart
L.B. Foster Co. (NASD:FSTR) Seasonal Chart
American Realty Investors Inc. (NYSE:ARL) Seasonal Chart
Bausch Health Cos. Inc. (NYSE:BHC) Seasonal Chart
Arvinas Inc. (NASD:ARVN) Seasonal Chart
iShares U.S. Medical Devices ETF (NYSE:IHI) Seasonal Chart
Electronic Arts, Inc. (NASD:EA) Seasonal Chart
Radcom Ltd. (NASD:RDCM) Seasonal Chart
Cirrus Logic, Inc. (NASD:CRUS) Seasonal Chart
Valeura Energy Inc. (TSE:VLE.TO) Seasonal Chart
The Markets
Stocks struggled a bit amidst strength in the US Dollar on Friday, but still managed to close higher on the day. The S&P 500 Index ended the session up by over three-tenths of one percent, moving higher from support at the 20-day moving average (5886), along with gap support that was opened around two weeks ago between 5783 and 5864, a zone that was reasonable to be filled before the march higher aligned with seasonal norms continued around the US Thanksgiving holiday, now upon us. On a intermediate-term scale, there remains greater evidence of support than resistance, presenting the desired backdrop for strength that is normally realized in the market at year-end. Major moving averages are all pointed higher and momentum indicators continue to gyrate above their middle lines, providing characteristics of a bullish trend. Our list of candidates in the market to Accumulate and to Avoid remains well positioned to benefit from the strength that is filtering into the market at this seasonally strong time of year, but we will scrutinize whether any changes are required as the price action evolves.
Today, in our Market Outlook to subscribers, we discuss the following:
- Weekly look at the large-cap benchmark
- Tendencies for stocks during the US Thanksgiving Week
- A look at our “fuel gauge” of the market: there is still gas left in the tank to drive stocks higher
- Net Assets on the Fed’s balance sheet
- Looking at the breakout of the US Dollar Index
- Canadian Retail Sales and what is driving activity
- The breakout of the Retail ETF from a trading range and the upside target that is implied
Subscribers can look for this report in their inbox or by clicking on the following link and logging in: Market Outlook for November 25
Not signed up yet? Subscribe now to receive full access to all of the research and analysis that we publish.
Sentiment on Friday, as gauged by the put-call ratio, ended bullish at 0.85.
Seasonal charts of companies reporting earnings today:
S&P 500 Index
TSE Composite
| Sponsored By... |

|


