Stock Market Outlook for December 6, 2024

Bitcoin has crossed above $100,000, but we have our eye on another cryptocurrency as a better bet through the months ahead.
*** Stocks highlighted are for information purposes only and should not be considered as advice to purchase or to sell mentioned securities. As always, the use of technical and fundamental analysis is encouraged in order to fine tune entry and exit points to average seasonal trends.
Stocks Entering Period of Seasonal Strength Today:
Subscribers Click on the relevant link to view the full profile. Not a subscriber? Signup here.
Merus BV (NASD:MRUS) Seasonal Chart
Alphamin Resources Corp. (TSXV:AFM.V) Seasonal Chart
Trigon Metals Inc. (TSXV:TM.V) Seasonal Chart
Fury Gold Mines Ltd. (TSE:FURY.TO) Seasonal Chart
Magnite, Inc (NASD:MGNI) Seasonal Chart
Invesco Senior Income Trust (NYSE:VVR) Seasonal Chart
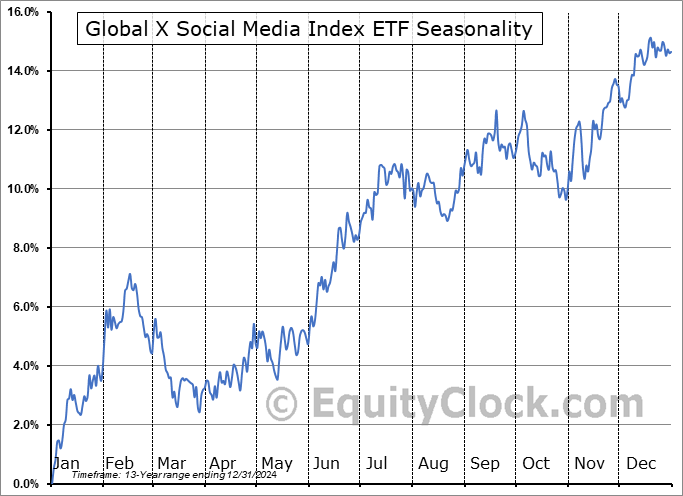
Global X Social Media Index ETF (NASD:SOCL) Seasonal Chart
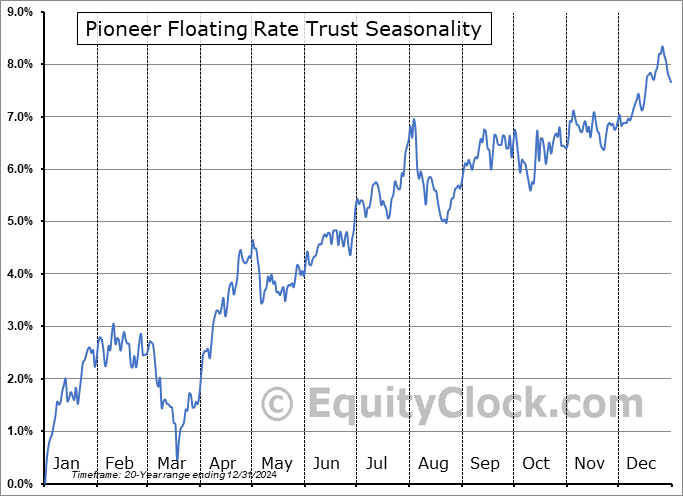
Pioneer Floating Rate Trust (NYSE:PHD) Seasonal Chart
Van Eck Merk Gold Trust (AMEX:OUNZ) Seasonal Chart
PureFunds Video Game Tech ETF (AMEX:GAMR) Seasonal Chart
Evolve Cyber Security ETF (TSE:CYBR.TO) Seasonal Chart
Paramount Global (NASD:PARA) Seasonal Chart
Smart Real Estate Investment Trust (TSE:SRU/UN.TO) Seasonal Chart
A&W Revenue Royalties Income Fund (TSE:AW/UN.TO) Seasonal Chart
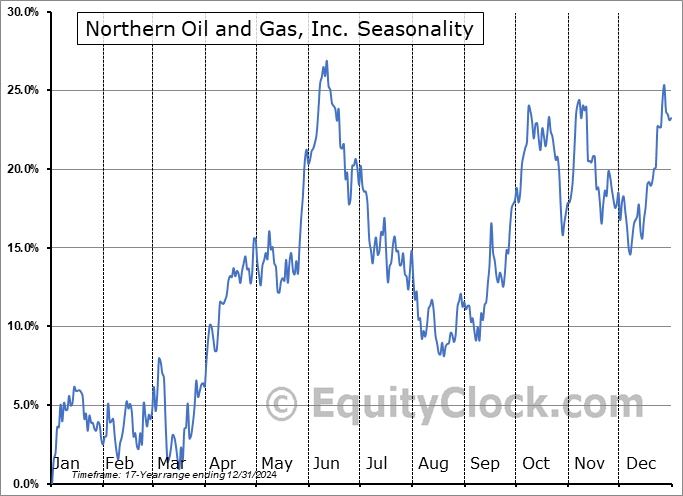
Northern Oil and Gas, Inc. (NYSE:NOG) Seasonal Chart
Lundin Gold Inc. (TSE:LUG.TO) Seasonal Chart
GoGold Resources Inc. (TSE:GGD.TO) Seasonal Chart
Erdene Resource Development Corp. (TSE:ERD.TO) Seasonal Chart
BTB Real Estate Investment Trust (TSE:BTB/UN.TO) Seasonal Chart
First Asset Canadian REIT ETF (TSE:RIT.TO) Seasonal Chart
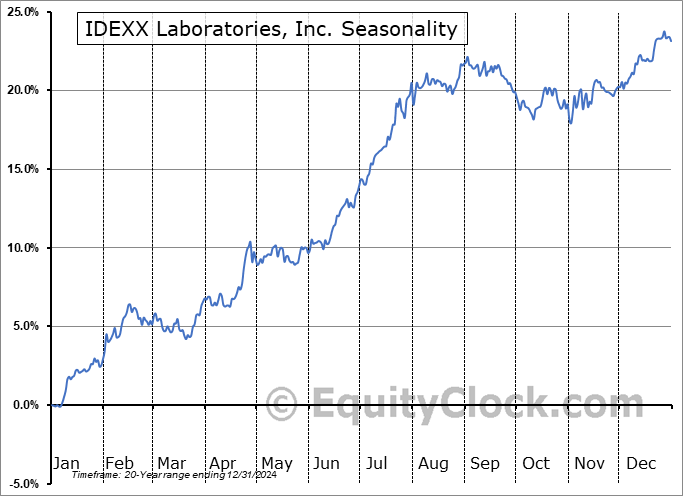
IDEXX Laboratories, Inc. (NASD:IDXX) Seasonal Chart
AltaGas Ltd. (TSE:ALA.TO) Seasonal Chart
Dream Industrial REIT (TSE:DIR/UN.TO) Seasonal Chart
Osisko Mining Inc. (TSE:OSK.TO) Seasonal Chart
iShares S&P/TSX Canadian Dividend Aristocrats Index ETF (TSE:CDZ.TO) Seasonal Chart
iShares Gold Bullion ETF (TSE:CGL/C.TO) Seasonal Chart
VanEck Vectors Uranium+Nuclear Energy ETF (NYSE:NLR) Seasonal Chart
The Markets
Stocks took a bit of a breather on Thursday as market participants wait for the results of the monthly nonfarm payroll report that is slated to be released on Friday. The S&P 500 Index slipped by just less than two-tenths of one percent after charting a fresh intraday record high during the session. Support continues at the 20-day moving average (5985). The pullback into the last hour of the session caused a break of short-term rising trendline stemming from the November 19th double-bottom low at 5850, however, a trend of higher-highs and higher-lows remains; the 20-hour moving average is presently up-to-bat. On a intermediate-term scale, there remains greater evidence of support than resistance, presenting the desired backdrop for strength that is normally realized in the market at year-end. Major moving averages are all pointed higher and momentum indicators continue to gyrate above their middle lines, providing characteristics of a bullish trend. Our list of candidates in the market to Accumulate and to Avoid remains well positioned to benefit from the strength that is filtering into the market at this seasonally strong time of year, but we will scrutinize whether any changes are required as the price action evolves.
Today, in our Market Outlook to subscribers, we discuss the following:
- Bitcoin, what would cause us to rein in our favourable view to Accumulate exposure, and the seasonality surrounding the cryptocurrency
- The cryptocurrency that may present the better opportunity for portfolios through the months ahead
- VIX falling to levels around the lows of the year, but not yet crossing the threshold to suggest complacency
- Tendencies for the Volatility Index during Post Election years
- Weekly Jobless Claims and the health of the labor market
- A look ahead at what to expect from November’s Nonfarm Payroll report
Subscribers can look for this report in their inbox or by clicking on the following link and logging in: Market Outlook for December 6
Not signed up yet? Subscribe now to receive full access to all of the research and analysis that we publish.
Sentiment on Thursday, as gauged by the put-call ratio, ended bullish at 0.81.
Seasonal charts of companies reporting earnings today:
S&P 500 Index
TSE Composite
| Sponsored By... |

|


