Stock Market Outlook for December 10, 2024

Some volatility/stall in the market over the near-term is reasonable as portfolio managers conduct their year-end trades; the Santa Claus rally period follows.
*** Stocks highlighted are for information purposes only and should not be considered as advice to purchase or to sell mentioned securities. As always, the use of technical and fundamental analysis is encouraged in order to fine tune entry and exit points to average seasonal trends.
Stocks Entering Period of Seasonal Strength Today:
Subscribers Click on the relevant link to view the full profile. Not a subscriber? Signup here.
BMO Equal Weight Industrials Index ETF (TSE:ZIN.TO) Seasonal Chart
Western Asset High Income Opportunity Fund Inc. (NYSE:HIO) Seasonal Chart
Invesco FTSE RAFI Canadian Index ETF (TSE:PXC.TO) Seasonal Chart
Verde Agritech Ltd. (TSE:NPK.TO) Seasonal Chart
Invesco DWA Emerging Markets Momentum ETF (NASD:PIE) Seasonal Chart
Invesco FTSE RAFI Developed Markets ex-U.S. Small-Mid ETF (NYSE:PDN) Seasonal Chart
KKR Income Opportunities Fund (NYSE:KIO) Seasonal Chart
iShares Convertible Bond ETF (AMEX:ICVT) Seasonal Chart
RF Capital Group Inc. (TSE:RCG.TO) Seasonal Chart
Bridgemarq Real Estate Services Inc (TSE:BRE.TO) Seasonal Chart
Harmony Gold Mining Co. Ltd. (NYSE:HMY) Seasonal Chart
DRDGOLD Ltd. (NYSE:DRD) Seasonal Chart
Vaalco Energy Inc. (NYSE:EGY) Seasonal Chart
Platinum Group Metals Ltd. (TSE:PTM.TO) Seasonal Chart
Mountain Province Mining, Inc. (TSE:MPVD.TO) Seasonal Chart
goeasy Ltd. (TSE:GSY.TO) Seasonal Chart
Endeavour Mining Corp. (TSE:EDV.TO) Seasonal Chart
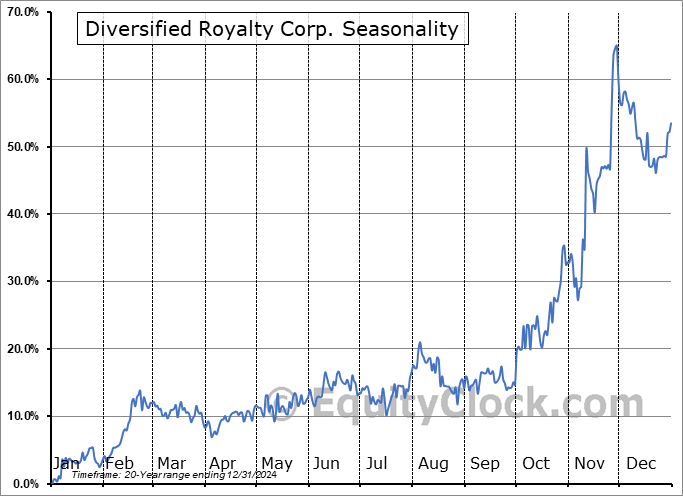
Diversified Royalty Corp. (TSE:DIV.TO) Seasonal Chart
Papa Johns Intl, Inc. (NASD:PZZA) Seasonal Chart
Taseko Mines Ltd. (AMEX:TGB) Seasonal Chart
Viper Energy, Inc (NASD:VNOM) Seasonal Chart
Kelso Technologies Inc. (AMEX:KIQ) Seasonal Chart
The Bank of Nova Scotia (TSE:BNS.TO) Seasonal Chart
NovaGold Resources Inc (AMEX:NG) Seasonal Chart
Psychemedics Corp. (NASD:PMD) Seasonal Chart
SLM Corp. (NASD:JSM) Seasonal Chart
Gran Tierra Energy, Inc. (AMEX:GTE) Seasonal Chart
The Markets
Stocks slipped to start the week as portfolio managers conduct year-end transactions before the distractions surrounding the end-of-year holidays begin. The S&P 500 Index lost six-tenths of one percent, pulling back slightly from the record closing high charted on Friday. Support continues at the 20-day moving average (5993). Monday’s drawdown works to close the upside gap that was charted last week between 6051 and 6065, presenting a logical zone to test as support. While not definitive that the short-term trajectory of the benchmark has shifted (unlikely ahead of the Santa Claus rally period), the benchmark is moving below rising short-term support that stems from the November 19th low. On a intermediate-term basis, there remains greater evidence of support than resistance, presenting the desired backdrop for strength that is normally realized in the market at year-end. Major moving averages are all pointed higher and momentum indicators continue to gyrate above their middle lines, providing characteristics of a bullish trend. Our list of candidates in the market to Accumulate and to Avoid remains well positioned to benefit from the strength that is filtering into the market at this seasonally strong time of year, but we will scrutinize whether any changes are required as the price action evolves.
Want to know which areas of the market to buy or sell? Our Weekly Chart Books have just been updated, providing a clear Accumulate, Avoid, or Neutral rating for currencies, cryptocurrencies, commodities, broad markets, and subsectors/industries of the market. Subscribers can login and click on the relevant links to access.
- Currencies
- Cryptocurrencies
- Commodities
- Major Benchmarks
- Sub-sectors / Industries
- ETFs: Bonds | Commodities | Equity Markets | Industries | Sectors
Subscribe now.
Today, in our Market Outlook to subscribers, we discuss the following:
- Our weekly chart books update, along with our list of all segments of the market to either Accumulate or Avoid
- Other Notes
- The jump in China ETFs from levels of significant support
- Putting Emerging Market Equities on watch
- Utilities sector showing upside exhaustion
- The declining trend of yields
Subscribers can look for this report in their inbox or by clicking on the following link and logging in: Market Outlook for December 10
Not signed up yet? Subscribe now to receive full access to all of the research and analysis that we publish.
Sentiment on Monday, as gauged by the put-call ratio, ended bullish at 0.78.
Seasonal charts of companies reporting earnings today:
S&P 500 Index
TSE Composite
| Sponsored By... |

|


