Stock Market Outlook for December 13, 2024

Initial claims surged last week to the highest level for the start of December since 2020, amidst the pandemic.
*** Stocks highlighted are for information purposes only and should not be considered as advice to purchase or to sell mentioned securities. As always, the use of technical and fundamental analysis is encouraged in order to fine tune entry and exit points to average seasonal trends.
Stocks Entering Period of Seasonal Strength Today:
Subscribers Click on the relevant link to view the full profile. Not a subscriber? Signup here.

Frontera Energy Corporation (TSE:FEC.TO) Seasonal Chart

Entergy New Orleans, Inc. (NYSE:ENO) Seasonal Chart

Inotiv, Inc. (NASD:NOTV) Seasonal Chart

Reinsurance Group of America, Inc. (NYSE:RZB) Seasonal Chart

Madison Square Garden Co. (NYSE:MSGS) Seasonal Chart

Tree Island Steel Ltd. (TSE:TSL.TO) Seasonal Chart

Invesco S&P MidCap Momentum ETF (AMEX:XMMO) Seasonal Chart

International Petroleum Corp. (TSE:IPCO.TO) Seasonal Chart

Vanguard U.S. Momentum Factor ETF (AMEX:VFMO) Seasonal Chart

CAE, Inc. (NYSE:CAE) Seasonal Chart

ReneSola Ltd. (NYSE:SOL) Seasonal Chart

Cipher Pharmaceuticals Inc. (TSE:CPH.TO) Seasonal Chart

Verint Systems, Inc. (NASD:VRNT) Seasonal Chart

Healthcare Services Group, Inc. (NASD:HCSG) Seasonal Chart

Teleflex, Inc. (NYSE:TFX) Seasonal Chart

Huntington Ingalls Industries Inc. (NYSE:HII) Seasonal Chart

Canaccord Financial Inc. (TSE:CF.TO) Seasonal Chart

CES Energy Solutions Corp. (TSE:CEU.TO) Seasonal Chart

H&Q Healthcare Inv Fund (NYSE:HQH) Seasonal Chart

Eastman Chemical Co. (NYSE:EMN) Seasonal Chart

Vanguard FTSE Canadian Capped REIT Index ETF (TSE:VRE.TO) Seasonal Chart

Schlumberger Ltd. (NYSE:SLB) Seasonal Chart

Unum Group (NYSE:UNM) Seasonal Chart

LyondellBasell Industries NV (NYSE:LYB) Seasonal Chart

Extendicare Inc. (TSE:EXE.TO) Seasonal Chart
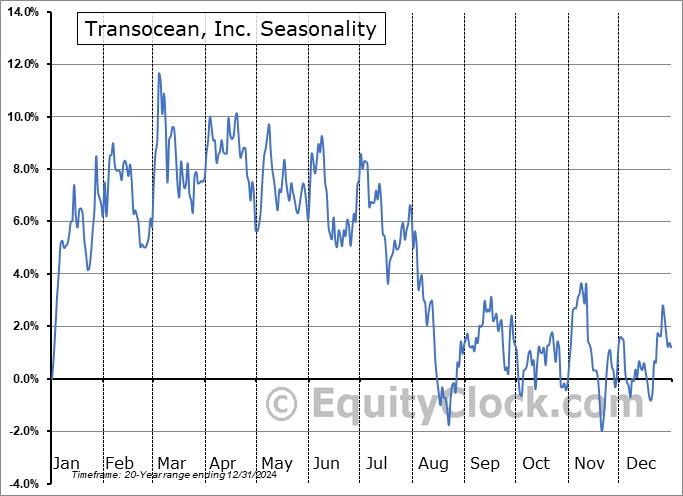
Transocean, Inc. (NYSE:RIG) Seasonal Chart

U.S. Energy Corp. (NASD:USEG) Seasonal Chart

Platinum Group Metals Ltd. (AMEX:PLG) Seasonal Chart

Enphase Energy Inc. (NASD:ENPH) Seasonal Chart

iShares Core S&P Small-Cap ETF (NYSE:IJR) Seasonal Chart

iShares Russell Mid-Cap ETF (NYSE:IWR) Seasonal Chart

Invesco S&P SmallCap Energy ETF (NASD:PSCE) Seasonal Chart

Invesco Dynamic Oil & Gas Services ETF (NYSE:PXJ) Seasonal Chart

SPDR S&P 600 Small Cap Value ETF (NYSE:SLYV) Seasonal Chart

Vanguard Mid-Cap ETF (NYSE:VO) Seasonal Chart

SPDR S&P Retail ETF (NYSE:XRT) Seasonal Chart
The Markets
Stocks wobbled on Thursday as portfolio managers returned to their end-of-year portfolio transactions before the distractions surrounding the holidays begin. The S&P 500 Index shed just over half of one percent, peeling back from the recent high charted around 6100. Support at the 20-day moving average (6003) continues to underpin this market, keeping the market positioned to buy upon each test. The short-term upside gap that was opened on Wednesday between 6045 and 6060 is currently being tested as a point of support. On a intermediate-term basis, there remains greater evidence of support than resistance, presenting the desired backdrop for strength that is normally realized in the market at year-end. Major moving averages are all pointed higher and momentum indicators continue to gyrate above their middle lines, providing characteristics of a bullish trend. Our list of candidates in the market to Accumulate and to Avoid remains well positioned to benefit from the strength that is filtering into the market at this seasonally strong time of year, but we will scrutinize whether any changes are required as the price action evolves.


Today, in our Market Outlook to subscribers, we discuss the following:
- US Producer Price Index (PPI) and the investment implications within
- Weekly jobless claims and the health of the labor market
- Post-Election Year tendencies for the price of Oil
Subscribers can look for this report in their inbox or by clicking on the following link and logging in: Market Outlook for December 13
Not signed up yet? Subscribe now to receive full access to all of the research and analysis that we publish.
Sentiment on Thursday, as gauged by the put-call ratio, ended bullish at 0.82.

Seasonal charts of companies reporting earnings today:
- No significant earnings scheduled for today.
S&P 500 Index


TSE Composite


| Sponsored By... |

|


