Stock Market Outlook for January 10, 2025

Last year, both initial and continued jobless claims showed the highest level for the end of December since 2020, showing an abnormal calendar year increase that is reminiscent of a pre-recessionary period.
*** Stocks highlighted are for information purposes only and should not be considered as advice to purchase or to sell mentioned securities. As always, the use of technical and fundamental analysis is encouraged in order to fine tune entry and exit points to average seasonal trends.
Stocks Entering Period of Seasonal Strength Today:
Subscribers Click on the relevant link to view the full profile. Not a subscriber? Signup here.
Computer Modelling Group Ltd. (TSE:CMG.TO) Seasonal Chart
Cinemark Holdings Corp. (NYSE:CNK) Seasonal Chart
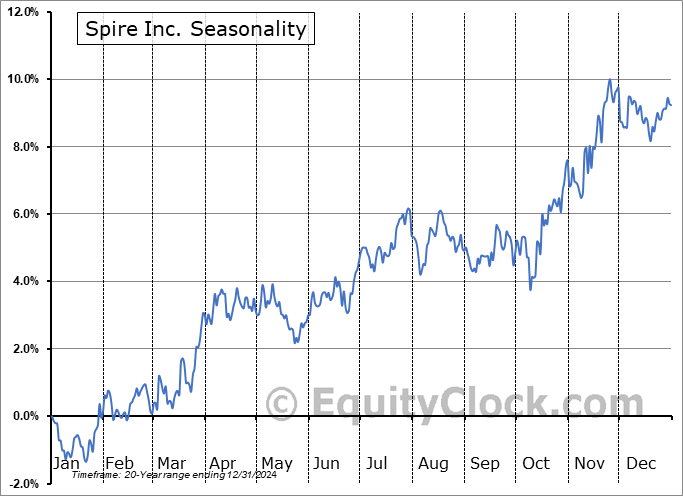
Spire Inc. (NYSE:SR) Seasonal Chart
Coda Octopus Group, Inc. (NASD:CODA) Seasonal Chart
National Storage Affiliates Trust (NYSE:NSA) Seasonal Chart
Grizzly Discoveries Inc. (TSXV:GZD.V) Seasonal Chart
Viemed Healthcare Inc. (NASD:VMD) Seasonal Chart
Invesco S&P 500 Equal Weight Consumer Staples ETF (NYSE:RSPS) Seasonal Chart
Corporate Office Properties Trust, LP (NYSE:CDP) Seasonal Chart
Badger Infrastructure Solutions Ltd. (TSE:BDGI.TO) Seasonal Chart
ENSERVCO Corp. (AMEX:ENSV) Seasonal Chart
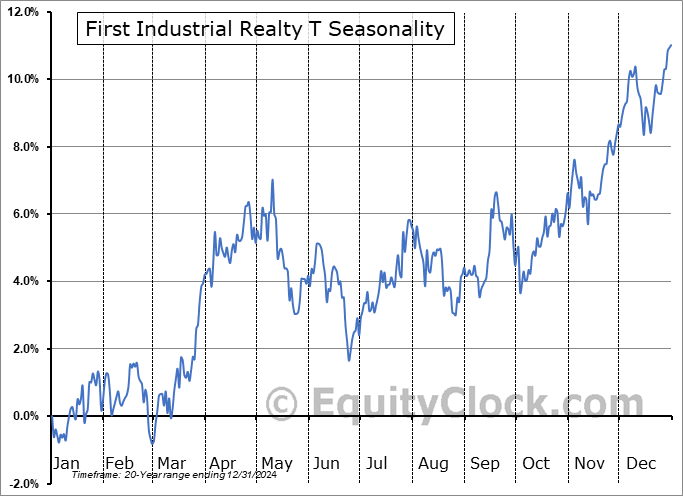
First Industrial Realty T (NYSE:FR) Seasonal Chart
Atmos Energy Corp. (NYSE:ATO) Seasonal Chart
Macy’s Inc. (NYSE:M) Seasonal Chart
Note: Thursday is a National Day of Mourning in the US for former President Jimmy Carter. As a result, US equity markets are closed in homage Carter’s memory on the day of his funeral. Our next reports will therefore be released on Friday when markets reopen.
The Markets
Stocks traded fairly flat on Wednesday, continuing to receive their cues from the fluctuations in the US Dollar and treasury yields. The S&P 500 Index ended up by 0.16% on Wednesday, remaining below resistance at the 20-day moving average (5972). The benchmark is back to interacting with the 50-day moving average (5952) that it has been clinging to in recent days, providing a rather neutral position for the intermediate-term trend. The benchmark remains above the previous level of horizontal support at the open gap charted following the US Election at 5850. A head-and-shoulders topping pattern can continue to be picked out based on the declines produced in recent weeks, but, previously, the low volume environment that the market has been within during the holiday timeframe provided little of significance to this topping setup. Tuesday’s session with money managers back in the driver’s seat certainly provides something to heighten the caution that the bearish pattern proposes. The setup points to a downside target of 5670, which was the level of resistance from this past summer’s high. Neckline support at 5850 would have to be definitively broken, first, to achieve the downside potential that the pattern suggests. Superseding any patterns that can be picked out is just the mere appearance that resistance, such as around the 20-day moving average, is starting to have a greater influence than support. Reason to conclude the shift of trend is starting to be provided. We continue to scrutinize the potential impact of this evolving shift on our list of candidates in the market to Accumulate and to Avoid and we would not be surprised to see our list of candidates in the market to Avoid expand following this first full week of the year once start of the year fund inflows are allocated.
Today, in our Market Outlook to subscribers, we discuss the following:
- Weekly Jobless Claims and the health of the labor market
- A look ahead at what to expect from December’s Nonfarm Payroll report that is slated to be released on Friday
- The weakest December change in US Vehicles sales in over two decades
- How Auto stocks are screening according to our three-pronged approach
- The subdued rise in Consumer Credit last year
Subscribers can look for this report in their inbox or by clicking on the following link and logging in: Market Outlook for January 10
Not signed up yet? Subscribe now to receive full access to all of the research and analysis that we publish.
Sentiment on Wednesday, as gauged by the put-call ratio, ended close to neutral at 0.95.
Seasonal charts of companies reporting earnings today:
S&P 500 Index
TSE Composite
| Sponsored By... |

|


