Stock Market Outlook for January 14, 2025

Reversal candlesticks charted on Monday are suggesting rotation away from former Growth (Technology) darlings and towards Value laggards.
*** Stocks highlighted are for information purposes only and should not be considered as advice to purchase or to sell mentioned securities. As always, the use of technical and fundamental analysis is encouraged in order to fine tune entry and exit points to average seasonal trends.
Stocks Entering Period of Seasonal Strength Today:
Subscribers Click on the relevant link to view the full profile. Not a subscriber? Signup here.
O’Reilly Automotive, Inc. (NASD:ORLY) Seasonal Chart
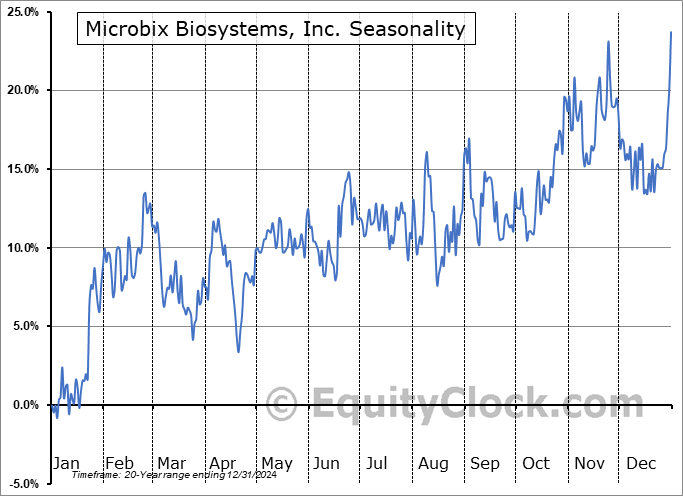
Microbix Biosystems, Inc. (TSE:MBX.TO) Seasonal Chart
TMX Group Inc. (TSE:X.TO) Seasonal Chart
SCP Pool Corp. (NASD:POOL) Seasonal Chart
Evolution Petroleum Corp. (AMEX:EPM) Seasonal Chart
iShares Canadian Growth Index ETF (TSE:XCG.TO) Seasonal Chart
Brown-Forman Corp. – Class A (NYSE:BF-A) Seasonal Chart
The Markets
Stocks traded mixed on Monday as funds came out of former growth (Technology) darlings and rotated towards value counterparts that have lagged in recent weeks/months. The S&P 500 Index gained 0.16% on Monday, retracing back to horizontal support that was broken on Friday at 5850. The horizontal threshold presents the neckline to a head-and-shoulders topping pattern, a bearish setup that proposes a downside target of 5670. Superseding any patterns that can be picked out is just the mere appearance that resistance, such as around the 20-day moving average, is starting to have a greater influence than support. Reason to conclude the shift of trend has been provided. We continue to scrutinize the potential impact of this evolving shift on our list of candidates in the market to Accumulate and to Avoid and we are expecting that our list will show more of a neutral appearance through the weeks ahead as segments that were previously noted as Accumulate candidates fall off and areas to Avoid are added.
Want to know which areas of the market to buy or sell? Our Weekly Chart Books have just been updated, providing a clear Accumulate, Avoid, or Neutral rating for currencies, cryptocurrencies, commodities, broad markets, and subsectors/industries of the market. Subscribers can login and click on the relevant links to access.
- Currencies
- Cryptocurrencies
- Commodities
- Major Benchmarks
- Sub-sectors / Industries
- ETFs: Bonds | Commodities | Equity Markets | Industries | Sectors
Subscribe now.
Today, in our Market Outlook to subscribers, we discuss the following:
- Our weekly chart books update, along with our list of all segments of the market to Accumulate or to Avoid
- Other Notes
- The rotation away from Technology and our scrutiny of the sector through the week ahead
- Core Value/Cyclical sectors charting bullish candlesticks to lend to the view of a short-term low
- Reducing reliance on Growth (Technology) in the Super Simple Seasonal Portfolio as the weaker time of the year for the market segment gets set to begin
Subscribers can look for this report in their inbox or by clicking on the following link and logging in: Market Outlook for January 14
Not signed up yet? Subscribe now to receive full access to all of the research and analysis that we publish.
Sentiment on Monday, as gauged by the put-call ratio, ended neutral at 1.00.
Seasonal charts of companies reporting earnings today:
S&P 500 Index
TSE Composite
| Sponsored By... |

|


