Stock Market Outlook for February 3, 2025

Performance of the equity market during the month of February is typically lacklustre with the S&P 500 Index averaging a gain of a mere 0.1%, on average, over the past five decades.
*** Stocks highlighted are for information purposes only and should not be considered as advice to purchase or to sell mentioned securities. As always, the use of technical and fundamental analysis is encouraged in order to fine tune entry and exit points to average seasonal trends.
Stocks Entering Period of Seasonal Strength Today:
Subscribers Click on the relevant link to view the full profile. Not a subscriber? Signup here.

Allstate Corp. (NYSE:ALL) Seasonal Chart

Roper Technologies, Inc. (NASD:ROP) Seasonal Chart

Tourmaline Oil Corp. (TSE:TOU.TO) Seasonal Chart

e.l.f. Beauty, Inc. (NYSE:ELF) Seasonal Chart

Roots Corporation (TSE:ROOT.TO) Seasonal Chart

International Seaways, Inc. (NYSE:INSW) Seasonal Chart
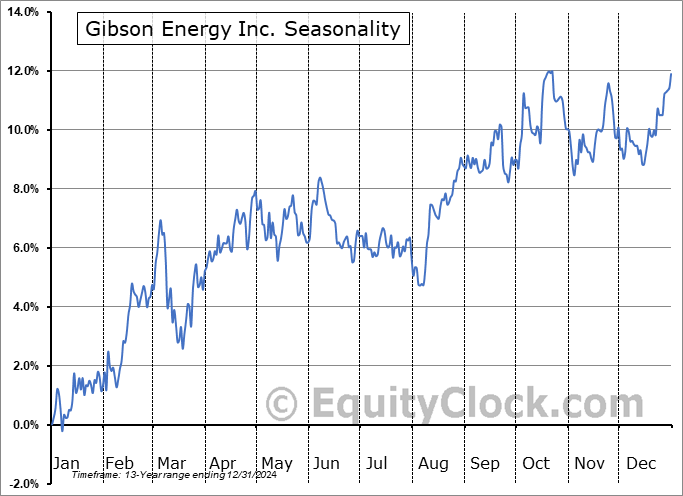
Gibson Energy Inc. (TSE:GEI.TO) Seasonal Chart

Yum! Brands Inc. (NYSE:YUM) Seasonal Chart

Baytex Energy Corp. (TSE:BTE.TO) Seasonal Chart

Birchcliff Energy Limited (TSE:BIR.TO) Seasonal Chart

PRA Group, Inc. (NASD:PRAA) Seasonal Chart

Alamos Gold Inc. (NYSE:AGI) Seasonal Chart

Linde plc (NASD:LIN) Seasonal Chart

Intl Flavors & Fragrances (NYSE:IFF) Seasonal Chart

Smith & Wesson Brands, Inc. (NASD:SWBI) Seasonal Chart

HanesBrands, Inc. (NYSE:HBI) Seasonal Chart

Atco Ltd. (TSE:ACO/X.TO) Seasonal Chart

DHI Group, Inc. (NYSE:DHX) Seasonal Chart
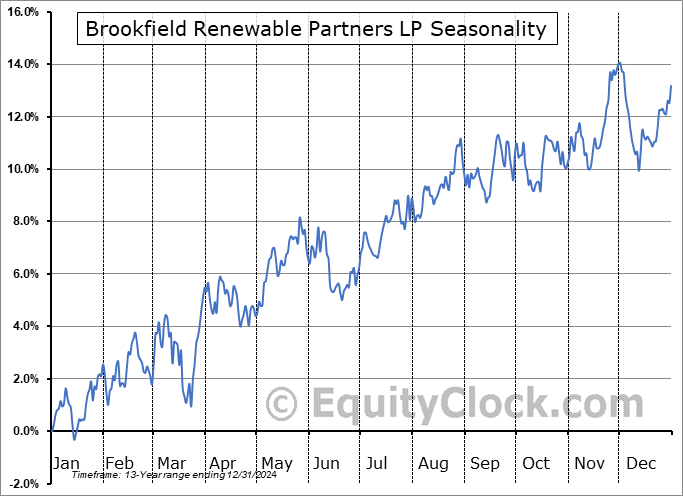
Brookfield Renewable Partners LP (NYSE:BEP) Seasonal Chart

Keurig Dr Pepper Inc. (NASD:KDP) Seasonal Chart

Grayscale Bitcoin Trust ETF (AMEX:GBTC) Seasonal Chart

VanEck Vectors Environmental Services ETF (NYSE:EVX) Seasonal Chart
The Markets
Stocks reversed early gains on Friday as investors expressed their concern over the implementation of tariffs on Canada, Mexico, and China that are slated to take effect on Saturday. The S&P 500 Index shed half of one percent, holding levels above the 20-day moving average (5979). The variable hurdle also closely aligns with previous short-term declining trendline resistance around 5975, a barrier that capped the benchmark over the past month. A reversal within the limits of the open gap that was opened during Monday’s selloff between 6017 and 6088 highlights the significance of this zone as resistance; traders are likely to look to sell into this zone through the days/weeks ahead as broader momentum dwindles. Momentum indicators have negatively diverged from price since the middle of last year, highlighting the waning enthusiasm investors had been expressing towards tech-heavy benchmarks, like this, amidst extreme valuations. We continue to monitor the potential impact of the apparent rotation in the market on our list of candidates in the market to Accumulate and to Avoid and we are still expecting that our list will show more of a neutral appearance through the weeks ahead as segments that were previously noted as Accumulate candidates fall off (eg. Technology), potentially replaced by some value segments of the market, and as areas to Avoid are added.


Today, in our Market Outlook to subscribers, we discuss the following:
- Monthly look at the large-cap index
- “As goes January, so goes the year”
- The rise in volatility that is normal through the month ahead
- Average performance of stocks during the month of February and the breakdown of how the market performs over the two halves of the month
- Securities that have gained or lost in every February over their trading history
- Canada GDP, the path towards recession, and the “golden” opportunity in the results
Subscribers can look for this report in their inbox or by clicking on the following link and logging in: Market Outlook for February 3
Not signed up yet? Subscribe now to receive full access to all of the research and analysis that we publish.
The month of February has historically been lacklustre for stocks. The S&P 500 Index has gained a mere 0.1%, on average, in this second month of the year over the past five decades with the frequency of positive results equally unimpressive at 56%. Returns have ranged from a loss of 11.0% in February of 2009 to a gain of 7.1% in February of 1986. We provide further insight on what to expect for the month ahead in our just released monthly outlook for February. Subscribe now.


Just Released…
Our monthly report for February is out, providing you with everything that you need to know to navigate the market through the month(s) ahead.
Highlights in this report include:
- Equity market tendencies in the month of February
- Cost of borrowing threatening to move higher this year
- Yields during post election years
- Inflationary pressures perking up into the end of 2024, likely to keep pressure on the bond market (yields)
- Important gauge of inflation expectations breaking out
- Looking at banks in an inflationary backdrop
- Beware the US Dollar
- Post-election year influence on the US Dollar
- Retail Sales
- Consumer loans ticked up into the end of 2024, but it may be providing further indication of a consumer under strain
- Industrial Production
- Refocussing the Artificial Intelligence (AI) trade for the new year
- Manufacturers in Philadelphia upbeat of their prospects into the early days of the Trump presidency
- Using Copper as a gauge of the health of the (industrial) economy for the year ahead
- Colder than average January could skew seasonally adjusted datapoints ahead
- Investor complacency jumping at the start of the year
- Our list of all segments of the market to either Accumulate or Avoid, along with relevant ETFs
- Positioning for the months ahead
- Sector Reviews and Ratings
- Stocks that have Frequently Gained in the Month of February
- Notable Stocks and ETFs Entering their Period of Strength in February
Subscribers can look for this 120-page report in their inbox and, soon, in the report archive.
Not subscribed yet? Signup now to receive access to this report and all of the research that we publish.
With the new month upon us and as we celebrate the release of our monthly report for February, today we release our screen of all of the stocks that have gained in every February over their trading history. While we at Equity Clock focus on a three-pronged approach (seasonal, technical, and fundamental analysis) to gain exposure to areas of the market that typically perform well over intermediate (2 to 6 months) timeframes, we know that stocks that have a 100% frequency of success for a particular month is generally of interest to those pursuing a seasonal investment strategy. Below are the results:

And how about those securities that have never gained in this second month of the year, here they are:

*Note: None of the results highlighted above have the 20 years of data that we like to see in order to accurately gauge the annual recurring, seasonal influences impacting an investment, therefore the reliability of the results should be questioned. We present the above list as an example of how our downloadable spreadsheet available to yearly subscribers can be filtered. For a more extensive list of high frequency (70%+) gainers for the month of February, please refer to our monthly report.
Sentiment on Friday, as gauged by the put-call ratio, ended bullish at 0.88.

Seasonal charts of companies reporting earnings today:


S&P 500 Index


TSE Composite


| Sponsored By... |

|


