Stock Market Outlook for February 4, 2025

Looking to become more Neutral in portfolio positioning at this seasonally weak time of year.
*** Stocks highlighted are for information purposes only and should not be considered as advice to purchase or to sell mentioned securities. As always, the use of technical and fundamental analysis is encouraged in order to fine tune entry and exit points to average seasonal trends.
Stocks Entering Period of Seasonal Strength Today:
Subscribers Click on the relevant link to view the full profile. Not a subscriber? Signup here.
BMO Low Volatility US Equity Hedged to CAD ETF (TSE:ZLH.TO) Seasonal Chart
iShares U.S. High Dividend Equity Index ETF (TSE:XHU.TO) Seasonal Chart
Yum China Holdings, Inc. (NYSE:YUMC) Seasonal Chart
United States 12 Month Oil Fund, LP (NYSE:USL) Seasonal Chart
K9 Gold Corp. (TSXV:KNC.V) Seasonal Chart
Invesco DB Oil Fund (NYSE:DBO) Seasonal Chart
Gear Energy Ltd. (TSE:GXE.TO) Seasonal Chart
Cadence Design Systems, Inc. (NASD:CDNS) Seasonal Chart
The Markets
Stocks closed firmly lower on Monday as traders expressed their concern over a potential tariff war. The S&P 500 Index shed just over three-quarters of one percent, closing right around 20 and 50-day moving averages (~5985). The benchmark is confirming resistance at the gap that was opened during last Monday’s selloff between 6017 and 6088. It was inevitable that traders would likely to look to sell into this zone, regardless of the reason, as broader momentum dwindles. Momentum indicators have negatively diverged from price since the middle of last year, highlighting the waning enthusiasm investors had been expressing towards tech-heavy benchmarks, like this, amidst extreme valuations. We continue to monitor the potential impact of the apparent rotation in the market on our list of candidates in the market to Accumulate and to Avoid and we have adopted more of a neutral appearance as segments that were previously noted as Accumulate candidates fall off (eg. Technology) and as areas to Avoid are added.
Want to know which areas of the market to buy or sell? Our Weekly Chart Books have just been updated, providing a clear Accumulate, Avoid, or Neutral rating for currencies, cryptocurrencies, commodities, broad markets, and subsectors/industries of the market. Subscribers can login and click on the relevant links to access.
- Currencies
- Cryptocurrencies
- Commodities
- Major Benchmarks
- Sub-sectors / Industries
- ETFs: Bonds | Commodities | Equity Markets | Industries | Sectors
Subscribe now.
Today, in our Market Outlook to subscribers, we discuss the following:
- Our weekly chart books update, along with our list of all market segments to Accumulate or Avoid
- Other Notes
- The action that we are taking in the Super Simple Seasonal Portfolio
Subscribers can look for this report in their inbox or by clicking on the following link and logging in: Market Outlook for February 4
Not signed up yet? Subscribe now to receive full access to all of the research and analysis that we publish.
Sentiment on Monday, as gauged by the put-call ratio, ended slightly bullish at 0.90.
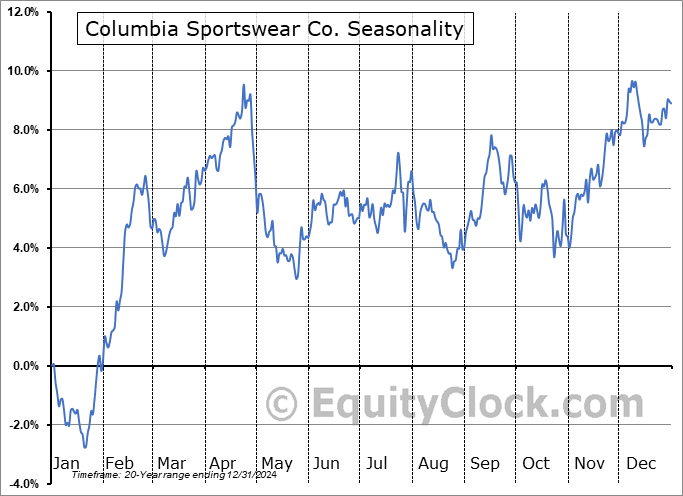
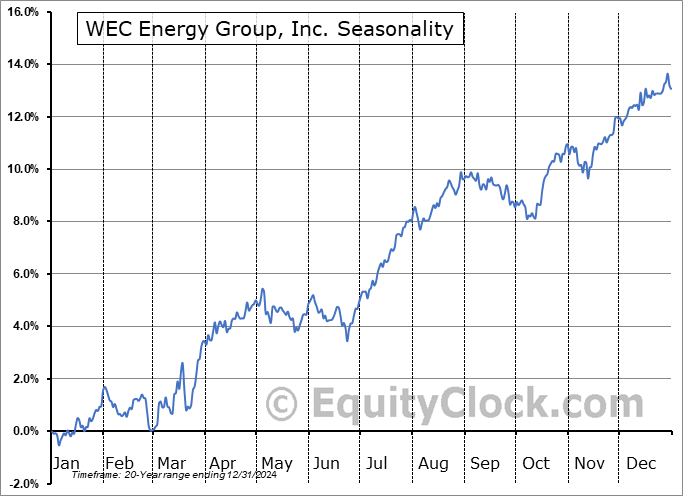
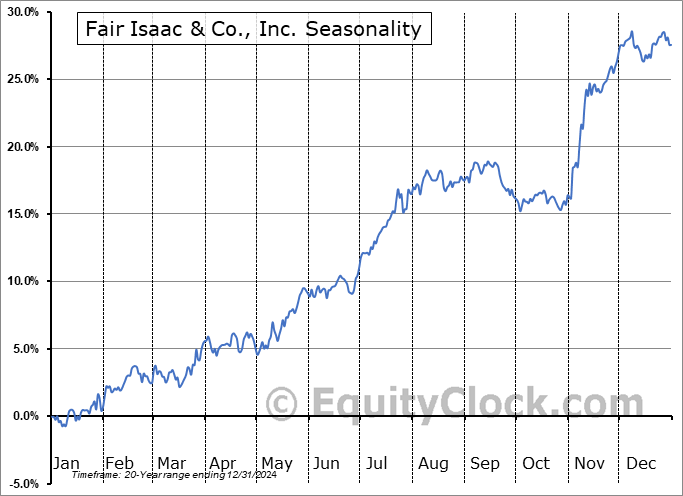
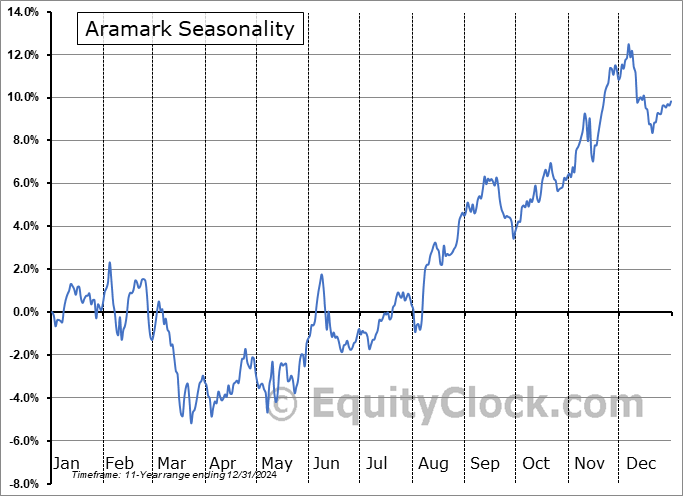
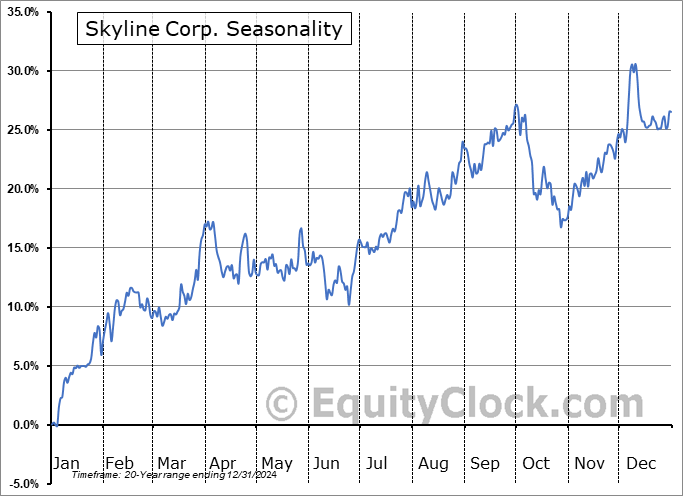
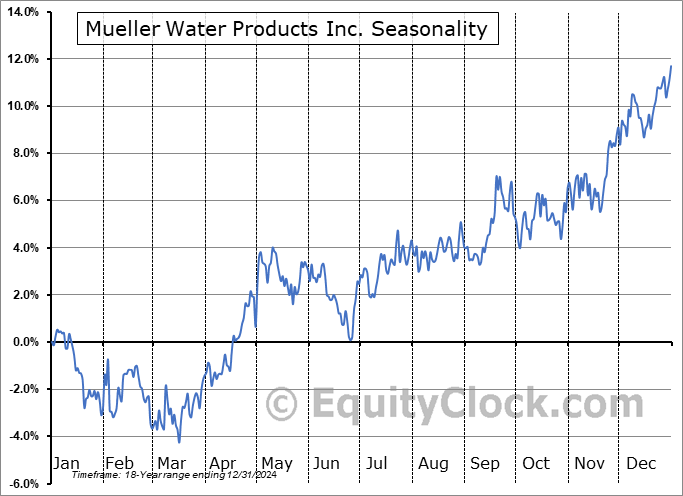
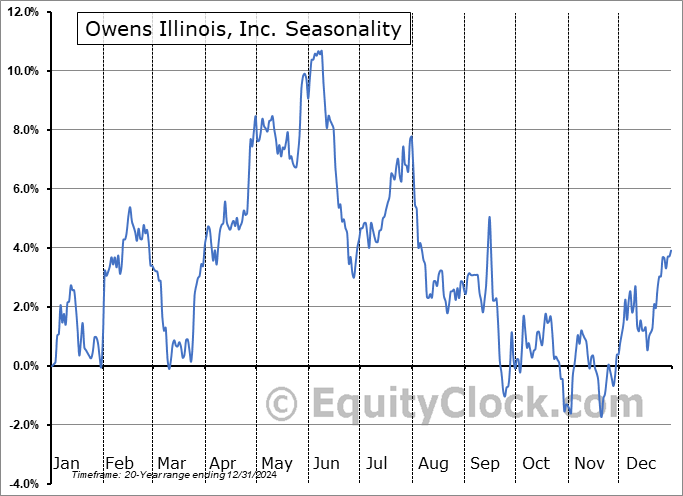
Seasonal charts of companies reporting earnings today:
S&P 500 Index
TSE Composite
| Sponsored By... |

|


