Stock Market Outlook for March 14, 2025

While headline risks remain high, the equity market has reached a zone where a snap-back has become highly likely.
*** Stocks highlighted are for information purposes only and should not be considered as advice to purchase or to sell mentioned securities. As always, the use of technical and fundamental analysis is encouraged in order to fine tune entry and exit points to average seasonal trends.
Stocks Entering Period of Seasonal Strength Today:
Subscribers Click on the relevant link to view the full profile. Not a subscriber? Signup here.

NIU Technologies (NASD:NIU) Seasonal Chart

Lantheus Holdings, Inc. (NASD:LNTH) Seasonal Chart

Nuveen ESG Large-Cap Growth ETF (AMEX:NULG) Seasonal Chart

First Asset Tech Giants Covered Call ETF (TSE:TXF/B.TO) Seasonal Chart

Vanguard FTSE Developed Markets ETF (NYSE:VEA) Seasonal Chart

Brown-Forman Corp. – Class A (NYSE:BF/A) Seasonal Chart

MicroSectors FANG+ ETN (AMEX:FNGS) Seasonal Chart

BMO Nasdaq 100 Equity Index ETF (TSE:ZNQ.TO) Seasonal Chart

iShares MSCI ACWI ex US ETF (NASD:ACWX) Seasonal Chart

Q2 Holdings, Inc. (NYSE:QTWO) Seasonal Chart

Ashford Hospitality Trust Inc. (NYSE:AHT) Seasonal Chart

Select Medical Holdings Corp. (NYSE:SEM) Seasonal Chart

Pine Cliff Energy Ltd. (TSE:PNE.TO) Seasonal Chart

Dollar General Corp. (NYSE:DG) Seasonal Chart

Oracle Corp. (NYSE:ORCL) Seasonal Chart
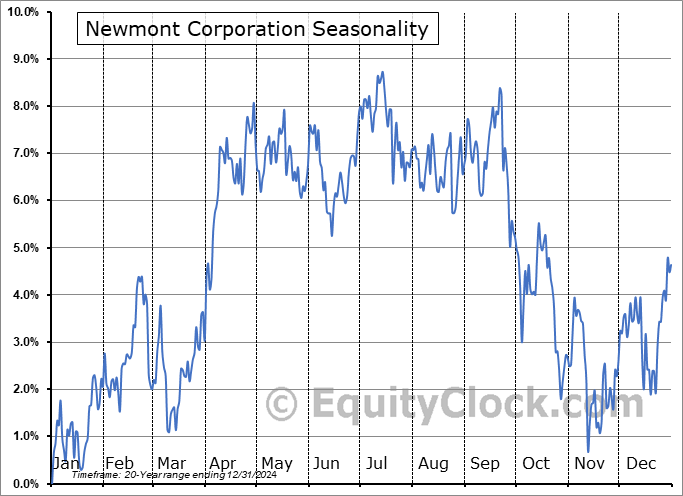
Newmont Corporation (NYSE:NEM) Seasonal Chart

Trevi Therapeutics, Inc. (NASD:TRVI) Seasonal Chart
The Markets
Stocks continue to respond to economic uncertainty as the Trump administration expresses their commitment to keep tariffs intact in order to draw activity back to the US. The S&P 500 Index ended down by 1.39%, remaining below support around the 200-day moving average (5738). The benchmark continues to sit around the furthest below this long-term hurdle since 2022. A declining short-term trend remains intact. A simple sign to suggest that the market is moving beyond this short-term declining path is if the benchmark is able to close above the high of the prior day, something that has not been seen since February 19th. At some point, a checkback of the now declining resistance at the 50-day moving average (5948) is reasonable and likely, at which point the true health of the intermediate-term trajectory of stocks can be determined. Markets that are showing greater resistance than support must be avoided, a framework, on an intermediate-term scale, we have not seen yet. Momentum indicators on the daily chart have negatively diverged from price since the middle of last year, highlighting the waning enthusiasm investors had been expressing towards tech-heavy (Mag-7) benchmarks, like this, amidst extreme valuations. For now, the drawdown in the market can still be viewed as healthy and ordinary within a bull market, by any measure, but scrutiny is certainly warranted now that some critical levels have been lost, such as 5700 on the S&P 500. Below this threshold, more dire scenarios for risk assets must be considered. We continue to monitor the potential impact of the apparent rotation in the market on our list of candidates in the market to Accumulate and to Avoid and we have adopted more of a neutral stance as segments that were previously noted as Accumulate candidates fall off (eg. Technology) and as areas to Avoid are added.


Today, in our Market Outlook to subscribers, we discuss the following:
- Headline risks high, but the market has reached a zone where a snap-back has become highly likely and what we are doing about it in the Super Simple Seasonal Portfolio
- Producer Price Index (PPI)
- Commodity prices remain firmly supported at this time of year
- Seasonal trade in Natural Gas
- Weekly Jobless Claims and the health of the labor market
- Investor sentiment
Subscribers can look for this report in their inbox or by clicking on the following link and logging in: Market Outlook for March 14
Not signed up yet? Subscribe now to receive full access to all of the research and analysis that we publish.
Sentiment on Thursday, as gauged by the put-call ratio, ended bearish at 1.08.

Seasonal charts of companies reporting earnings today:


S&P 500 Index


TSE Composite


| Sponsored By... |

|


