Stock Market Outlook for March 27, 2025

Stocks have slipped back to support at Monday’s upside open gap, providing a critical test to the oversold rebound from the mid-March lows.
*** Stocks highlighted are for information purposes only and should not be considered as advice to purchase or to sell mentioned securities. As always, the use of technical and fundamental analysis is encouraged in order to fine tune entry and exit points to average seasonal trends.
Stocks Entering Period of Seasonal Strength Today:
Subscribers Click on the relevant link to view the full profile. Not a subscriber? Signup here.
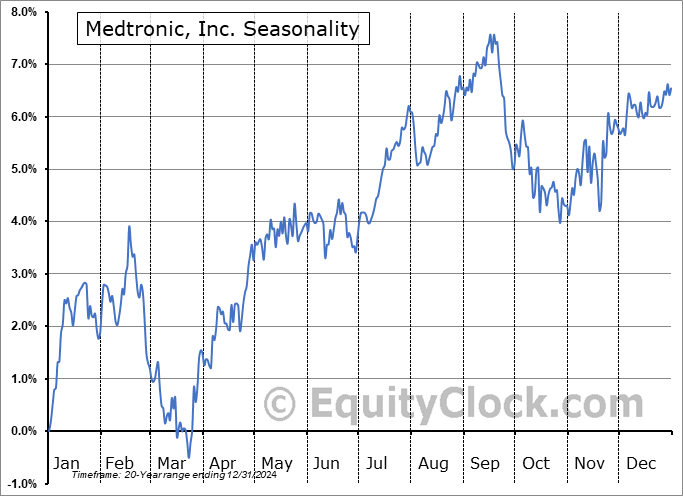
Medtronic, Inc. (NYSE:MDT) Seasonal Chart

Vertex Pharmaceuticals Inc. (NASD:VRTX) Seasonal Chart

Worthington Industries, Inc. (NYSE:WOR) Seasonal Chart

HealthStream, Inc. (NASD:HSTM) Seasonal Chart

iRobot Corp. (NASD:IRBT) Seasonal Chart

RadNet, Inc. (NASD:RDNT) Seasonal Chart

Surmodics, Inc. (NASD:SRDX) Seasonal Chart

Vital Energy Inc. (NYSE:VTLE) Seasonal Chart
The Markets
Throw in chatter of tariffs and a negative session in the equity market is the result. Headlines of the announcement of tariffs on autos resulted in a 1.12% decline in the S&P 500 Index on Wednesday, causing the benchmark to slip back below long-term support around the 200-day moving average (5756). The benchmark is now testing Monday’s upside gap that we have identified as support around 5700, an important test in this rebound attempt in the market that has materialized in the back half of March; a break of the short-term pivot point would lead to the suggestion that the near-term oversold bounce in the market into quarter-end has reached a peak, resuming what is becoming a declining intermediate-term trajectory stemming off of February’s highs. A check-back of the now declining resistance at the 50-day moving average (5910) remains our base case, at which point the true health of the intermediate-term trajectory of stocks can be determined, but we must be nimble with this target so long as headline risks remain elevated. Markets that are showing greater resistance than support over an intermediate-term timeframe must be avoided, a framework we have not been able to confirm, yet. The drawdown in the market has been viewed as healthy and ordinary within a bull market, by any measure, but scrutiny is certainly warranted given that some critical levels were broken during the correction, such as 5700 on the S&P 500. Below this threshold, more dire scenarios for risk assets must be considered. We are still in this period of seasonal strength that runs through the end of March and into the month of April, therefore there is a bias to give this favourable timeframe the benefit of the doubt; the more likely time to see a resumption of the declining intermediate-term path for stocks is through the off-season that starts in May. We continue to monitor the potential impact of the apparent rotation in the market on our list of candidates in the market to Accumulate and to Avoid and we have adopted more of a neutral stance as segments that were previously noted as Accumulate candidates fall off (eg. Technology) and as areas to Avoid are added.


Today, in our Market Outlook to subscribers, we discuss the following:
- Technology filling Monday’s upside gap support
- US Durable Goods Orders and the investment implications within
- Copper
Subscribers can look for this report in their inbox or by clicking on the following link and logging in: Market Outlook for March 27
Not signed up yet? Subscribe now to receive full access to all of the research and analysis that we publish.
Sentiment on Wednesday, as gauged by the put-call ratio, ended close to neutral at 0.96.

Seasonal charts of companies reporting earnings today:


S&P 500 Index


TSE Composite


| Sponsored By... |

|


