Stock Market Outlook for March 31, 2025

While stocks are currently showing strain, one of the strongest months of the year for performance is directly ahead: The S&P 500 Index has averaged a return of 1.7% in April with a gain frequency of 72%.
*** Stocks highlighted are for information purposes only and should not be considered as advice to purchase or to sell mentioned securities. As always, the use of technical and fundamental analysis is encouraged in order to fine tune entry and exit points to average seasonal trends.
Stocks Entering Period of Seasonal Strength Today:
Subscribers Click on the relevant link to view the full profile. Not a subscriber? Signup here.

Gamehost Inc. (TSE:GH.TO) Seasonal Chart

McCoy Bros., Inc. (TSE:MCB.TO) Seasonal Chart

Dawson Geophysical Co. (NASD:DWSN) Seasonal Chart

Teucrium Corn Fund (NYSE:CORN) Seasonal Chart

APA Corporation (NASD:APA) Seasonal Chart

Key Tronic Corp. (NASD:KTCC) Seasonal Chart

Silicon Motion Technology Corp. ADS (NASD:SIMO) Seasonal Chart
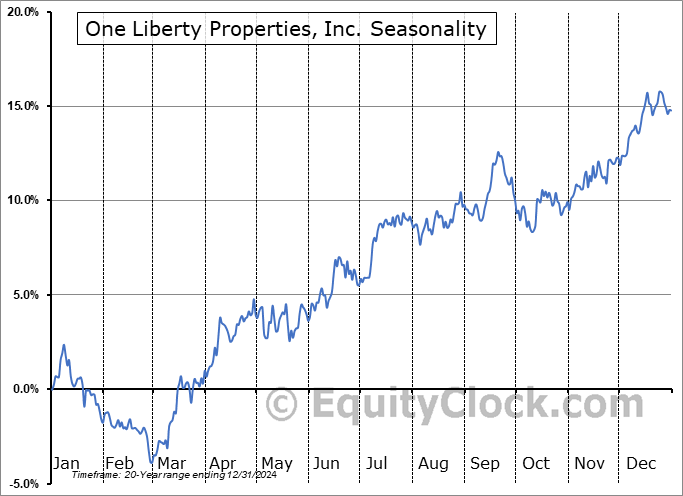
One Liberty Properties, Inc. (NYSE:OLP) Seasonal Chart

Dundee Corp. (TSE:DC/A.TO) Seasonal Chart

Keyera Corp (TSE:KEY.TO) Seasonal Chart

Pason Systems, Inc. (TSE:PSI.TO) Seasonal Chart

Occidental Petroleum Corp. (NYSE:OXY) Seasonal Chart

Carolina Rush Corp. (TSXV:RUSH.V) Seasonal Chart
The Markets
A hotter than expected read of inflationary pressures in the economy and another drop in consumer sentiment weighed on the equity market during Friday’s session, derailing the normally upbeat performance that stocks typically realize into quarter-end. The S&P 500 Index dropped by nearly two percent, falling firmly back below long-term support around the 200-day moving average (5759) and violating an ultra-short-term point of support at 5600. Gap support charted on Monday around 5700 has failed, providing the suggestion that the near-term oversold bounce in the market into quarter-end has come to an end. The next point to watch on the downside is, quite obviously, the mid-March low at 5500. A check-back of the now declining resistance at the 50-day moving average (5900) has been our base case, but headline risks are proving to be too high at the present time for this reflux higher to stick. This week, the benchmark failed around 5748, which is the 38.2% Fibonacci retracement level of the February/March pullback and the inability for the benchmark to get above this hurdle on this bounce characterizes a very weak recovery, indicative of a market that wants to move lower (below the lows that were charted around 5500). We are still in this period of seasonal strength that runs through the end of March and into the month of April, therefore there is a bias to give this favourable timeframe the benefit of the doubt; the more likely time to see a resumption of the declining intermediate-term path for stocks is through the off-season that starts in May. We are not going to make any changes to our Super Simper Seasonal Portfolio, yet, following our tactical positioning to take advantage of the positivity that surrounds the end of the quarter, but we are cognizant that the intermediate-term trajectory that is of most importance to us in our work is becoming increasingly threatened. We continue to monitor the potential impact of the apparent rotation in the market on our list of candidates in the market to Accumulate and to Avoid and we have adopted more of a neutral stance as segments that were previously noted as Accumulate candidates fall off (eg. Technology) and as areas to Avoid are added.


Today, in our Market Outlook to subscribers, we discuss the following:
- Weekly look at the large-cap benchmark
- Scrutinizing the performance of the MAG-7
- April: A strong month for stocks
- Tendency for stocks in this fourth month of the year
- Securities that have gained or lost in every April over their trading history
- Margin Debt in investor accounts
- Canada Gross Domestic Product (GDP) and the investment implications within
Subscribers can look for this report in their inbox or by clicking on the following link and logging in: Market Outlook for March 31
Not signed up yet? Subscribe now to receive full access to all of the research and analysis that we publish.
Looking towards the month of April, over the past five decades, the S&P 500 Index has averaged a return of 1.7% in the fourth month of the year with a gain frequency of 72%. This is the second best average performance of the year and it reiterates a desire to maintain some type of positive bias in risk assets during this spring month. Returns have ranged from a loss of 8.8% in April of 2022 to a gain of 12.7% in April of 2020. We dive into everything that you need to know for the month ahead in our just released monthly report for April. Subscribe now.


Just Released…
Our monthly report for April is out, providing you with everything that you need to know to navigate the market through the month(s) ahead.
Highlights in this report include:
- Equity market tendencies in the month of April
- Individual Investors the most bearish since 2022
- Asset manager exposure to S&P 500 still around the highs of the past decade
- Watching the trajectory of earnings expectations heading towards the off-season for stocks
- How “on point” are analysts with their expectations at the present time
- Watch credit spreads for signs of economic struggle
- Investors looking for certainty outside of the US
- Spring is the time for real estate
- Medical devices
- Time to overweight bonds?
- April’s currency tailwind
- Second weakest February change in Retail Sales on record
- Consumer Loan activity still struggling
- Consumer momentum the lowest since the pandemic
- Industrial Production
- Consumer goods producers racing to front run the imposition of tariffs
- Utilities not so hot in February, but still a desired investment
- Manufacturer sentiment has become dampened amidst the tariff uncertainty
- Commodities remain well supported at this seasonally strong time of year
- New high engine has been turned off
- Our list of all segments of the market to either Accumulate or Avoid, along with relevant ETFs
- Positioning for the months ahead
- Sector Reviews and Ratings
- Stocks that have Frequently Gained in the Month of April
- Notable Stocks and ETFs Entering their Period of Strength in April
Subscribers can look for this 113-page report in their inbox and, soon, in the report archive.
Not subscribed yet? Signup now to receive access to this report and all of the research that we publish.
With the new month upon us and as we celebrate the release of our monthly report for April, today we release our screen of all of the stocks that have gained in every April over their trading history. While we at Equity Clock focus on a three-pronged approach (seasonal, technical, and fundamental analysis) to gain exposure to areas of the market that typically perform well over intermediate (2 to 6 months) timeframes, we know that stocks that have a 100% frequency of success for a particular month is generally of interest to those pursuing a seasonal investment strategy. Below are the results:

And how about those securities that have never gained in this fourth month of the year, here they are:

*Note: None of the results highlighted above have the 20 years of data that we like to see in order to accurately gauge the annual recurring, seasonal influences impacting an investment, therefore the reliability of the results should be questioned. We present the above list as an example of how our downloadable spreadsheet available to yearly subscribers can be filtered. For a more extensive list of high frequency (70% ) gainers for the month of April, please refer to our monthly report.
Sentiment on Friday, as gauged by the put-call ratio, ended bearish at 1.02.

Seasonal charts of companies reporting earnings today:


S&P 500 Index


TSE Composite


| Sponsored By... |

|


