Stock Market Outlook for April 17, 2025

The Dollar Index is pushing below significant multi-year support at 100 and the breakdown may be just getting started.
*** Stocks highlighted are for information purposes only and should not be considered as advice to purchase or to sell mentioned securities. As always, the use of technical and fundamental analysis is encouraged in order to fine tune entry and exit points to average seasonal trends.
Stocks Entering Period of Seasonal Strength Today:
Subscribers Click on the relevant link to view the full profile. Not a subscriber? Signup here.

ImmuCell Corp. (NASD:ICCC) Seasonal Chart

Starr Peak Exploration Ltd. (TSXV:STE.V) Seasonal Chart

Ohio Valley Banc Corp. (NASD:OVBC) Seasonal Chart

Argenx SE (NASD:ARGX) Seasonal Chart

SiteOne Landscape Supply, Inc. (NYSE:SITE) Seasonal Chart

Biogen Inc. (NASD:BIIB) Seasonal Chart

iShares Global Healthcare Index ETF (CAD-Hedged) (TSE:XHC.TO) Seasonal Chart

Amphastar Pharmaceuticals, Inc. (NASD:AMPH) Seasonal Chart

Veeva Systems Inc. (NYSE:VEEV) Seasonal Chart

Northwest Pipe Co. (NASD:NWPX) Seasonal Chart

Manhattan Bridge Capital Inc. (NASD:LOAN) Seasonal Chart

Omnicell Inc. (NASD:OMCL) Seasonal Chart

ICU Medical, Inc. (NASD:ICUI) Seasonal Chart
The Markets
Stocks traded sharply lower on Wednesday amidst a selloff in shares of NVIDIA (NVDA) and comments from Fed Chair Jerome Powell that failed to provide certainty to investors in this highly uncertain market. The S&P 500 Index ended lower by 2.24%, showing a sharp rejection from resistance at the pre-tariff announcement lows around 5500. There is a cap over this market in the range between 5500 and 5800 that would likely require a catalyst to break; without one, look for the sellers to step in around this zone. As has been pointed out, the benchmark remains in a precarious state heading into the second quarter, holding levels below the 200-day moving average, a variable hurdle that is now rolling over and providing a characteristic of an intermediate to long-term bearish trend. Unfortunately, this technical degradation in the market has come during this period of seasonal strength that runs through the month of April, therefore we are biased to let this favourable timeframe show what it is capable of before taking action; the more likely time that the next evolution of the declining intermediate-to-long-term trend for stocks should occur is through the off-season that starts in May. We continue to leave our Super Simple Seasonal Portfolio as is, but we are cognizant of the need to do something ahead to mitigate the threat that the intermediate-term trend is portraying. We continue to monitor the potential impact of the rotation in the market on our list of candidates in the market to Accumulate and to Avoid, but we have been finding things to buy amidst this market tumult.


Today, in our Market Outlook to subscribers, we discuss the following:
- The break of significant support for the US Dollar Index
- Commodities holding strong, benefiting our Accumulate listed candidates in our weekly chart books
- US Retail Sales and the investment implications within
- Retailer inventories
- Visa Spending Momentum Index
- Retail stocks
Subscribers can look for this report in their inbox or by clicking on the following link and logging in: Market Outlook for April 17
Not signed up yet? Subscribe now to receive full access to all of the research and analysis that we publish.
Sentiment on Wednesday, as gauged by the put-call ratio, ended bearish at 1.03.

Seasonal charts of companies reporting earnings today:


S&P 500 Index


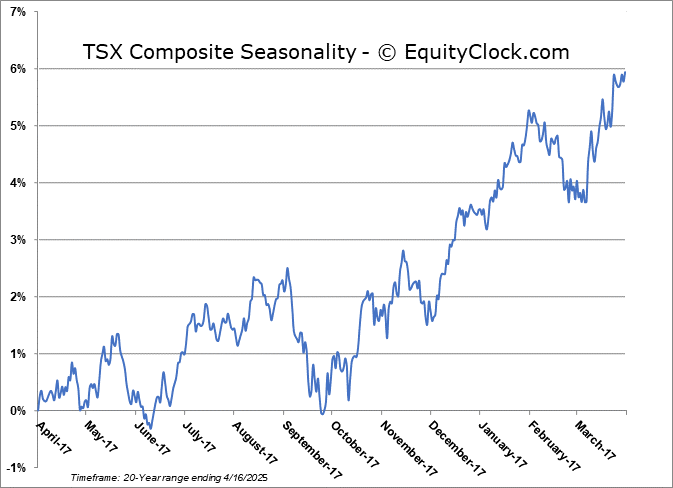
TSE Composite

| Sponsored By... |

|


