Stock Market Outlook for April 23, 2025

Copper-Gold ratio has reached down to the pandemic low amidst the rally in the precious metal.
*** Stocks highlighted are for information purposes only and should not be considered as advice to purchase or to sell mentioned securities. As always, the use of technical and fundamental analysis is encouraged in order to fine tune entry and exit points to average seasonal trends.
Stocks Entering Period of Seasonal Strength Today:
Subscribers Click on the relevant link to view the full profile. Not a subscriber? Signup here.

Ameren Corp. (NYSE:AEE) Seasonal Chart

Intuitive Surgical, Inc. (NASD:ISRG) Seasonal Chart

Altisource Portfolio Solutions S.A. (NASD:ASPS) Seasonal Chart

XCel Brands, Inc. (NASD:XELB) Seasonal Chart

RumbleOn, Inc. (NASD:RMBL) Seasonal Chart

Verra Mobility Corporation (NASD:VRRM) Seasonal Chart
The Markets
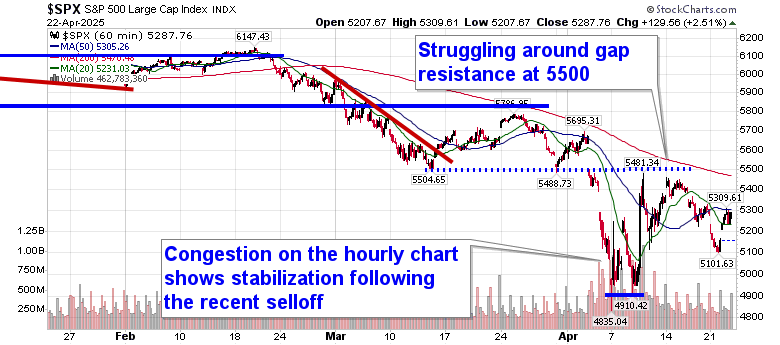
Optimism that trade tensions between the US and China could ease had investors jumping back into stocks on Tuesday as this roller coaster ride in the market continues. The S&P 500 Index erased Monday’s decline to end higher by 2.51%, remaining below the declining 20-day moving average (5404). There is a cap over this market in the range between 5500 and 5800 that would likely require a catalyst to break; without one, look for the sellers to step in around this zone. As has been pointed out, the benchmark remains in a precarious state heading into the second quarter, holding levels below the 200-day moving average, a variable hurdle that is now rolling over and providing a characteristic of an intermediate to long-term bearish trend. Unfortunately, this technical degradation in the market has come during this period of seasonal strength that runs through the month of April, therefore we are biased to let this favourable timeframe show what it is capable of before taking action, particularly with how washed out stocks have recently become; the more likely time that the next evolution of the declining intermediate-to-long-term trend for stocks should occur is through the off-season that starts in May. We continue to leave our Super Simple Seasonal Portfolio as is, but we are cognizant of the need to do something ahead to mitigate the threat that the intermediate-term trend is portraying. We continue to monitor the potential impact of the rotation in the market on our list of candidates in the market to Accumulate and to Avoid, but we are finding things to buy amidst this market tumult.

Today, in our Market Outlook to subscribers, we discuss the following:
- Percent of stocks trading above 20-day moving averages continue to improve from the severely oversold levels charted at the start of April
- Copper-Gold Ratio
- US Housing Starts, Building Permits, and the rise of land inventory on the books of builders
- Homebuilder stocks
- Consumer Loan activity
- Consumers relying on Home Equity Loans to bridge the gap in their finances
Subscribers can look for this report in their inbox or by clicking on the following link and logging in: Market Outlook for April 23
Not signed up yet? Subscribe now to receive full access to all of the research and analysis that we publish.
Sentiment on Tuesday, as gauged by the put-call ratio, ended bullish at 0.86.

Seasonal charts of companies reporting earnings today:


S&P 500 Index


TSE Composite


| Sponsored By... |

|


