Stock Market Outlook for April 29, 2025

Short-term breadth indicators continue to improve off of their significant oversold lows charted earlier in April, but scrutiny of the trend will be warranted ahead as the equity market enters its offseason.
*** Stocks highlighted are for information purposes only and should not be considered as advice to purchase or to sell mentioned securities. As always, the use of technical and fundamental analysis is encouraged in order to fine tune entry and exit points to average seasonal trends.
Stocks Entering Period of Seasonal Strength Today:
Subscribers Click on the relevant link to view the full profile. Not a subscriber? Signup here.

AvePoint Inc. (NASD:AVPT) Seasonal Chart

Discovery Silver Corp. (TSE:DSV.TO) Seasonal Chart

Vanguard Russell 1000 Growth ETF (NASD:VONG) Seasonal Chart

Edgewell Personal Care Co. (NYSE:EPC) Seasonal Chart

Nuveen Build America Bond Fund (NYSE:NBB) Seasonal Chart

Blackrock Long Term Municipal Advantage Trust (NYSE:BTA) Seasonal Chart

BMO Long Federal Bond Index ETF (TSE:ZFL.TO) Seasonal Chart

iShares Core Canadian Long Term Bond Index ETF (TSE:XLB.TO) Seasonal Chart

Alimentation Couche-Tard, Inc. (TSE:ATD/A.TO) Seasonal Chart

FlexShopper, Inc. (NASD:FPAY) Seasonal Chart

Richards Packaging Income Fund (TSE:RPI/UN.TO) Seasonal Chart
The Markets
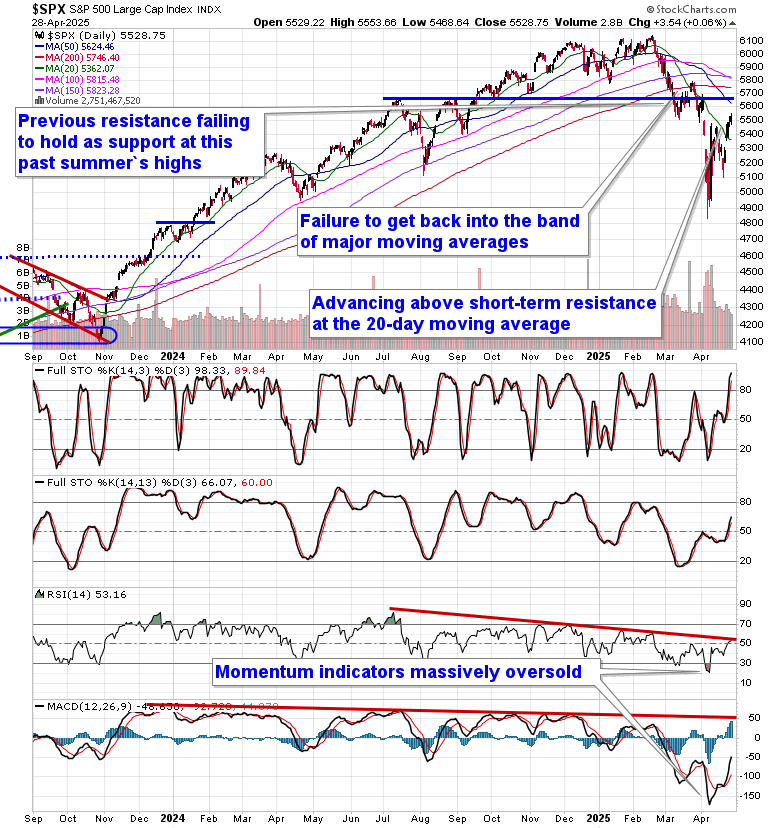
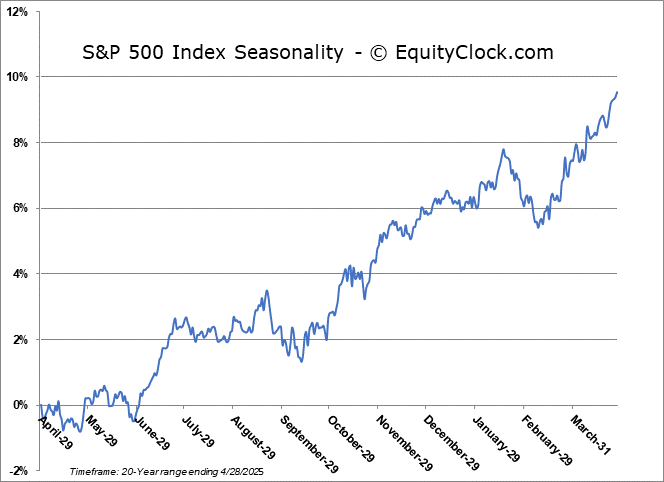
Stocks closed mixed on Monday as investors eye a busy week for earnings and brace for the always pivotal monthly employment report to be released on Friday. The S&P 500 Index added a mere six basis points (0.06%), continuing to progress above the declining 20-day moving average (5362) and staying afloat above resistance at 5500. There remains an implied cap over this market in the range between 5500 and 5800 that would likely require a catalyst to break (eg. progress towards a trade deal with China); without one, look for the sellers to step in around this zone. As has been pointed out, the benchmark remains in a precarious state heading into the second quarter, holding levels below the 200-day moving average, a variable hurdle that is now rolling over and providing a characteristic of an intermediate to long-term bearish trend. Unfortunately, this technical degradation in the market has come during this period of seasonal strength that runs through the month of April, therefore we have been biased to let this favourable timeframe play out before taking action, particularly with how washed out stocks have recently become; the more likely time that the next evolution of the declining intermediate-to-long-term trend for stocks should occur is through the off-season that starts in May. We continue to leave our Super Simple Seasonal Portfolio as is, but we are cognizant of the need to do something ahead to mitigate the threat that the intermediate-term trend is portraying. We continue to monitor the potential impact of the rotation in the market on our list of candidates in the market to Accumulate and to Avoid, but we are finding things to buy amidst this market tumult.

Today, in our Market Outlook to subscribers, we discuss the following:
- A short-term indication of breadth continues to improve
- Our weekly chart books update, along with our list of all segments of the market to either Accumulate or Avoid
- Other Notes
- The Consumer Finance industry
Subscribers can look for this report in their inbox or by clicking on the following link and logging in: Market Outlook for April 29
Not signed up yet? Subscribe now to receive full access to all of the research and analysis that we publish.
Want to know which areas of the market to buy or sell? Our Weekly Chart Books have just been updated, providing a clear Accumulate, Avoid, or Neutral rating for currencies, cryptocurrencies, commodities, broad markets, and subsectors/industries of the market. Subscribers can login and click on the relevant links to access.
- Currencies
- Cryptocurrencies
- Commodities
- Major Benchmarks
- Sub-sectors / Industries
- ETFs: Bonds | Commodities | Equity Markets | Industries | Sectors
Subscribe now.
Sentiment on Monday, as gauged by the put-call ratio, ended bullish at 0.85.

Seasonal charts of companies reporting earnings today:


S&P 500 Index

TSE Composite


| Sponsored By... |

|


