Stock Market Outlook for May 1, 2025

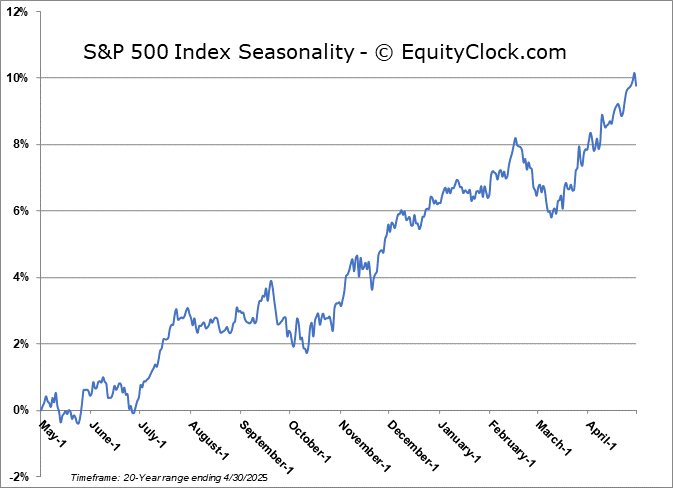
While the start of the off-season for stocks gets underway in May, the S&P 500 Index has still averaged a gain of 0.8% during this fifth month of the year over the past five decades.
*** Stocks highlighted are for information purposes only and should not be considered as advice to purchase or to sell mentioned securities. As always, the use of technical and fundamental analysis is encouraged in order to fine tune entry and exit points to average seasonal trends.
Stocks Entering Period of Seasonal Strength Today:
Subscribers Click on the relevant link to view the full profile. Not a subscriber? Signup here.

Hon Industries, Inc. (NYSE:HNI) Seasonal Chart

Ameresco Inc. (NYSE:AMRC) Seasonal Chart

Regional Management Corp. (NYSE:RM) Seasonal Chart

Ooma, Inc. (NYSE:OOMA) Seasonal Chart

Hut 8 Mining Corp. (NASD:HUT) Seasonal Chart

iShares Self-Driving EV and Tech ETF (AMEX:IDRV) Seasonal Chart
The Markets
Stocks shook off earlier losses attributed to a weak read of US GDP on Wednesday to close fairly mixed in the final trading session of April. The S&P 500 Index added just over a tenth of one percent, continuing to progress above the declining 20-day moving average (5356) and staying afloat above resistance at 5500. There remains an implied cap over this market in the range between 5500 and 5800 that would likely require a catalyst to break (eg. progress towards a trade deal with China); without one, look for the sellers to step in around this zone. Initial reaction to resistance around the declining 50-day moving average (5602) was picked up early on Wednesday, causing an intraday move below the lows of the prior session and suggesting some hesitation among investors around this zone. The daily MACD histogram has started to stall and buying demand from this bear-market rally can be suggested to be waning. This is enticing us to start legging out of equity allocations heading into the offseason for stocks that begins in May as we brace for the next evolution of the intermediate-term trend in the equity market that is leaning negative. We continue to monitor the potential impact of the rotation in the market on our list of candidates in the market to Accumulate and to Avoid, but we have found rotation/buying candidates in recent weeks amidst this market tumult.


Today, in our Market Outlook to subscribers, we discuss the following:
- Monthly look at the large-cap benchmark
- Tendencies for stocks during the month of May
- The list of securities that have gained or lost in every May over their trading history
- The change in margin debt and credit balances in investor accounts
- Canada Gross Domestic Product (GDP) and the investment implications within
- Cyclically sensitive commodities preparing for an economic drawdown
- The change we are making in the Super Simple Seasonal Portfolio
Subscribers can look for this report in their inbox or by clicking on the following link and logging in: Market Outlook for May 1
Not signed up yet? Subscribe now to receive full access to all of the research and analysis that we publish.
Looking ahead, over the past five decades, the S&P 500 Index has averaged a return of 0.8% in the fifth month of the year with a gain frequency of 68%. Returns have ranged from a loss of 8.2% in May of 2010 to a gain of 9.2% in May of 1990. We break down everything that you need to know for the month ahead in our just released monthly report for May. Subscribe now.


Just Released…
Our monthly report for May is out, providing you with everything that you need to know to navigate the market through the month(s) ahead.
Highlights in this report include:
- Equity market tendencies in the month of May
- Examining the Sell In May and Go Away strategy
- Investors fleeing the US
- Short-term lending facilities thriving in this equity market chaos
- Credit spreads reflecting the strains in the economy and concerns being borne by the market
- Commodities providing one of the few diversifiers to portfolios in this volatile environment
- Defense or Offense: Industry groups that provide the best of both worlds during the summer
- Looking for an opportunity in India
- Growing upside potential in Agriculture Stocks
- Time to overweight bonds?
- US Industrial Production
- Business optimism well below average for this time of year, if present at all
- Small Businesses struggling amidst the tariff fight
- Retail Sales
- Our list of all segments of the market to either Accumulate or Avoid, along with relevant ETFs
- Positioning for the months ahead
- Sector Reviews and Ratings
- Stocks that have Frequently Gained in the Month of May
- Notable Stocks and ETFs Entering their Period of Strength in May
Subscribers can look for this 109-page report in their inbox and, soon, in the report archive.
Not subscribed yet? Signup now to receive access to this report and all of the research that we publish.
With the new month upon us and as we celebrate the release of our monthly report for May, today we release our screen of all of the stocks that have gained in every May over their trading history. While we at Equity Clock focus on a three-pronged approach (seasonal, technical, and fundamental analysis) to gain exposure to areas of the market that typically perform well over intermediate (2 to 6 months) timeframes, we know that stocks that have a 100% frequency of success for a particular month is generally of interest to those pursuing a seasonal investment strategy. Below are the results:

And how about those securities that have never gained in this fifth month of the year, here they are:

*Note: None of the results highlighted above have the 20 years of data that we like to see in order to accurately gauge the annual recurring, seasonal influences impacting an investment, therefore the reliability of the results should be questioned. We present the above list as an example of how our downloadable spreadsheet available to yearly subscribers can be filtered. For a more extensive list of high frequency (70%+) gainers for the month of May, please refer to our monthly report.
Sentiment on Wednesday, as gauged by the put-call ratio, ended bullish at 0.82.

Seasonal charts of companies reporting earnings today:


S&P 500 Index

TSE Composite


| Sponsored By... |

|


