Stock Market Outlook for May 2, 2025

Capital investment is being locked up amidst economic uncertainty and this has caused one of the weakest March changes for Private Nonresidential Construction Spending on record.
*** Stocks highlighted are for information purposes only and should not be considered as advice to purchase or to sell mentioned securities. As always, the use of technical and fundamental analysis is encouraged in order to fine tune entry and exit points to average seasonal trends.
Stocks Entering Period of Seasonal Strength Today:
Subscribers Click on the relevant link to view the full profile. Not a subscriber? Signup here.

Herbalife Nutrition Ltd. (NYSE:HLF) Seasonal Chart

Sapiens Intl Corp. N.V. (NASD:SPNS) Seasonal Chart
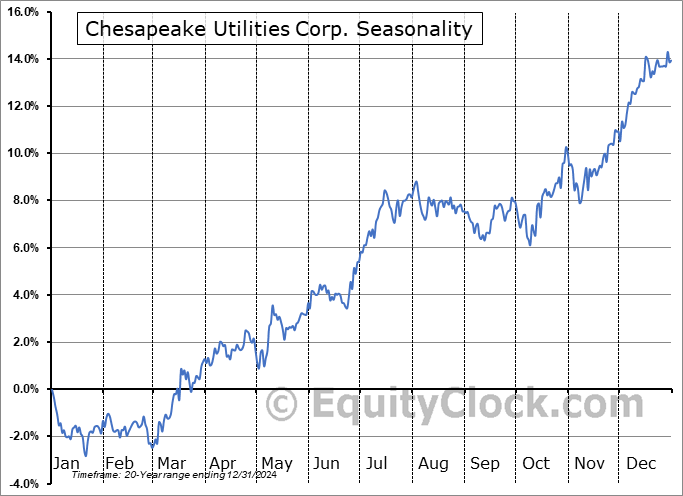
Chesapeake Utilities Corp. (NYSE:CPK) Seasonal Chart

Hannon Armstrong Sustainable Infastructure Capital Inc. (NYSE:HASI) Seasonal Chart

iShares Canadian Real Return Bond Index ETF (TSE:XRB.TO) Seasonal Chart
The Markets
Reaction to earnings from a couple of technology titans (Meta and Microsoft) gave lift to the broader market on Thursday as investors attempt to find the light amidst all of the darkness that the economy is clouded in. The S&P 500 Index added just over six-tenths of one percent, continuing to progress above the declining 20-day moving average (5352) and staying afloat above previous short-term resistance at 5500. There remains an implied cap over this market in the range between 5500 and 5800 that would likely require a catalyst to break (eg. progress towards a trade deal with China); without one, look for the sellers to step in around this zone. Indecision candlesticks around the declining 50-day moving average (5591) have been charted over the past two sessions, suggesting some hesitation among investors is already materializing. The daily MACD histogram has started to stall and buying demand from this bear-market rally can be suggested to be waning. This is enticing us to start legging out of equity allocations heading into the offseason for stocks that begins in May as we brace for the next evolution of the intermediate-term trend in the equity market that is leaning negative. We continue to monitor the potential impact of the rotation in the market on our list of candidates in the market to Accumulate and to Avoid, but we have found rotation/buying candidates in recent weeks amidst this market tumult.


Today, in our Market Outlook to Subscribers, we discuss the following:
- Percent of stocks trading above 20-day moving averages starting to slip around short-term overbought territory
- Weekly Jobless Claims and the health of the labor market
- A look ahead at what to expect from the monthly Nonfarm Payroll report
- US Construction Spending
- Analyzing the Dynamic Building and Construction ETF
- The action we are taking in the Super Simple Seasonal Portfolio
Subscribers can look for this report in their inbox or by clicking on the following link and logging in: Market Outlook for May 2
Not signed up yet? Subscribe now to receive full access to all of the research and analysis that we publish.
Sentiment on Thursday, as gauged by the put-call ratio, ended bullish at 0.83.

Just Released…
Our monthly report for May is out, providing you with everything that you need to know to navigate the market through the month(s) ahead.
Highlights in this report include:
- Equity market tendencies in the month of May
- Examining the Sell In May and Go Away strategy
- Investors fleeing the US
- Short-term lending facilities thriving in this equity market chaos
- Credit spreads reflecting the strains in the economy and concerns being borne by the market
- Commodities providing one of the few diversifiers to portfolios in this volatile environment
- Defense or Offense: Industry groups that provide the best of both worlds during the summer
- Looking for an opportunity in India
- Growing upside potential in Agriculture Stocks
- Time to overweight bonds?
- US Industrial Production
- Business optimism well below average for this time of year, if present at all
- Small Businesses struggling amidst the tariff fight
- Retail Sales
- Our list of all segments of the market to either Accumulate or Avoid, along with relevant ETFs
- Positioning for the months ahead
- Sector Reviews and Ratings
- Stocks that have Frequently Gained in the Month of May
- Notable Stocks and ETFs Entering their Period of Strength in May
Subscribers can look for this 109-page report in their inbox and in the report archive.
Not subscribed yet? Signup now to receive access to this report and all of the research that we publish.
Seasonal charts of companies reporting earnings today:


S&P 500 Index


TSE Composite


| Sponsored By... |

|


