Stock Market Outlook for May 5, 2025

Everything outside of the US is breaking out as equity investors rotate to other countries around the globe with greater certainty.
*** Stocks highlighted are for information purposes only and should not be considered as advice to purchase or to sell mentioned securities. As always, the use of technical and fundamental analysis is encouraged in order to fine tune entry and exit points to average seasonal trends.
Stocks Entering Period of Seasonal Strength Today:
Subscribers Click on the relevant link to view the full profile. Not a subscriber? Signup here.

McKesson Corp. (NYSE:MCK) Seasonal Chart

WD-40 Co. (NASD:WDFC) Seasonal Chart

Digi Intl Inc. (NASD:DGII) Seasonal Chart

Health Care Select Sector SPDR Fund (NYSE:XLV) Seasonal Chart

Match Group, Inc (NASD:MTCH) Seasonal Chart

Centerspace (NYSE:CSR) Seasonal Chart

XP Inc (NASD:XP) Seasonal Chart

Alphabet Inc. (NASD:GOOGL) Seasonal Chart
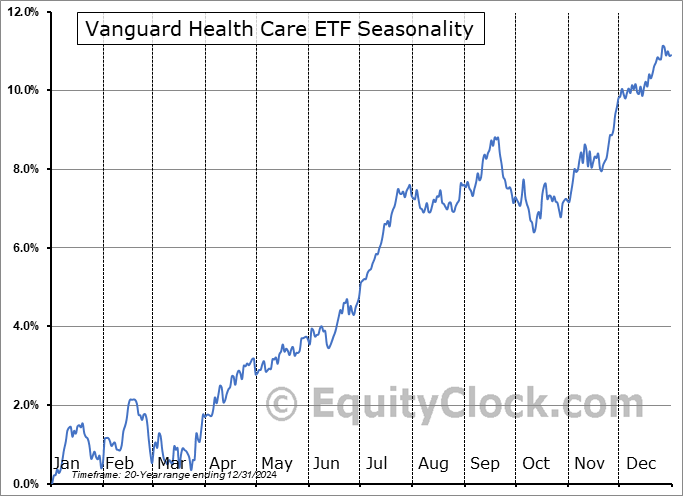
Vanguard Health Care ETF (NYSE:VHT) Seasonal Chart

Royal Gold, Inc. (NASD:RGLD) Seasonal Chart

MSCI, Inc. (NYSE:MSCI) Seasonal Chart

Barings BDC, Inc. (NYSE:BBDC) Seasonal Chart

iShares MSCI USA Momentum Factor ETF (AMEX:MTUM) Seasonal Chart

NV5 Global, Inc. (NASD:NVEE) Seasonal Chart

Virco Manufacturing Corp. (NASD:VIRC) Seasonal Chart

Gildan Activewear, Inc. (NYSE:GIL) Seasonal Chart

Novavax, Inc. (NASD:NVAX) Seasonal Chart
The Markets
Headlines that China is evaluating the possibility of starting trade negotiations with the US lit a fire under the equity market on Friday. The S&P 500 Index added 1.47%, moving beyond the declining 50-day moving average (5582) and reaching back towards the 200-day average (5746). There remains an implied cap over this market in the range between 5500 and 5800, corresponding to the upper limit of the cloud of major moving averages that was broken in March, that would likely require a catalyst to break (eg. progress towards a trade deal with China); without one, look for the sellers to step in around this zone. Indecision candlesticks around the declining 50-day moving average on Wednesday and Thursday lent itself to the suggestion of hesitation among investors, but the incremental positivity received from China’s announcement is placing the short-term recovery from the April lows into extra innings. We were enticed to use the strength over the past couple of sessions to start legging out of equity allocations heading into the offseason for stocks that begins at this time of year as we brace for the next evolution of the intermediate-term trend in the equity market that is still leaning negative. We continue to monitor the potential impact of the rotation in the market on our list of candidates in the market to Accumulate and to Avoid, but we have found rotation/buying candidates in recent weeks amidst this market tumult.


Today, in our Market Outlook to subscribers, we discuss the following:
- Weekly look at the large-cap benchmark and the key levels to scrutinize overhead
- All Country Ex-US breaking out to new highs
- The action that we are taking in the Super Simple Seasonal Portfolio
- US Employment Situation and the investment implications within
- The emerging lag in the path of wages
Subscribers can look for this report in their inbox or by clicking on the following link and logging in: Market Outlook for May 5
Not signed up yet? Subscribe now to receive full access to all of the research and analysis that we publish.
Sentiment on Friday, as gauged by the put-call ratio, ended bullish at 0.84.

Seasonal charts of companies reporting earnings today:


S&P 500 Index


TSE Composite


| Sponsored By... |

|


