Stock Market Outlook for May 9, 2025

Percent of stocks trading above 200-day moving averages showing characteristic of a volatile equity market trend.
*** Stocks highlighted are for information purposes only and should not be considered as advice to purchase or to sell mentioned securities. As always, the use of technical and fundamental analysis is encouraged in order to fine tune entry and exit points to average seasonal trends.
Stocks Entering Period of Seasonal Strength Today:
Subscribers Click on the relevant link to view the full profile. Not a subscriber? Signup here.

Columbia India Consumer ETF (NYSE:INCO) Seasonal Chart

Dynatrace Inc. (NYSE:DT) Seasonal Chart

AdaptHealth Corp (NASD:AHCO) Seasonal Chart

Zscaler, Inc. (NASD:ZS) Seasonal Chart

SPDR S&P 500 Growth ETF (NYSE:SPYG) Seasonal Chart

Adobe Systems, Inc. (NASD:ADBE) Seasonal Chart

Globant SA (NYSE:GLOB) Seasonal Chart

CareDx Inc. (NASD:CDNA) Seasonal Chart

Sirius XM Holdings Inc. (NASD:SIRI) Seasonal Chart

Seabridge Gold Inc. (TSE:SEA.TO) Seasonal Chart

Canadian Western Bank (TSE:CWB.TO) Seasonal Chart

H & R Block, Inc. (NYSE:HRB) Seasonal Chart
The Markets
Stocks drifted higher on Thursday as the US announced its first major trade deal amidst its tariff rollout and as investors braced for any news that may come out over the weekend when trade representatives between the US and China meet in Switzerland. The S&P 500 Index added just less than six-tenths of one percent, continuing to show reaction to a point of horizontal resistance at 5650. The 200-day moving average remains overhead and the significant doji indecision candlestick charted during the Thursday’s session hints that traders are paying attention to the hurdle. There remains an implied cap over this market in the range between 5500 and 5800, corresponding with the span of the cloud of major moving averages that was broken in March, that would likely require a catalyst to break (eg. progress towards a trade deal with China); without one, look for the sellers to step in around this zone. We were enticed to use the strength through the end of last week to start legging out of equity allocations heading into the offseason for stocks that begins at this time of year as we brace for the next evolution of the intermediate-term trend in the equity market that is still leaning negative. We continue to monitor the potential impact of the rotation in the market on our list of candidates in the market to Accumulate and to Avoid, but we have found rotation/buying candidates in recent weeks amidst this market tumult.


Today, in our Market Outlook to subscribers, we discuss the following:
- Percent of stocks in the S&P 500 Index above their 200-day moving averages
- Weekly jobless claims and the health of the labor market
- The seasonal trade in Natural Gas
- Wholesale Sales and Inventories
Subscribers can look for this report in their inbox or by clicking on the following link and logging in: Market Outlook for May 9
Not signed up yet? Subscribe now to receive full access to all of the research and analysis that we publish.
Sentiment on Thursday, as gauged by the put-call ratio, ended bullish at 0.82.

Seasonal charts of companies reporting earnings today:


S&P 500 Index


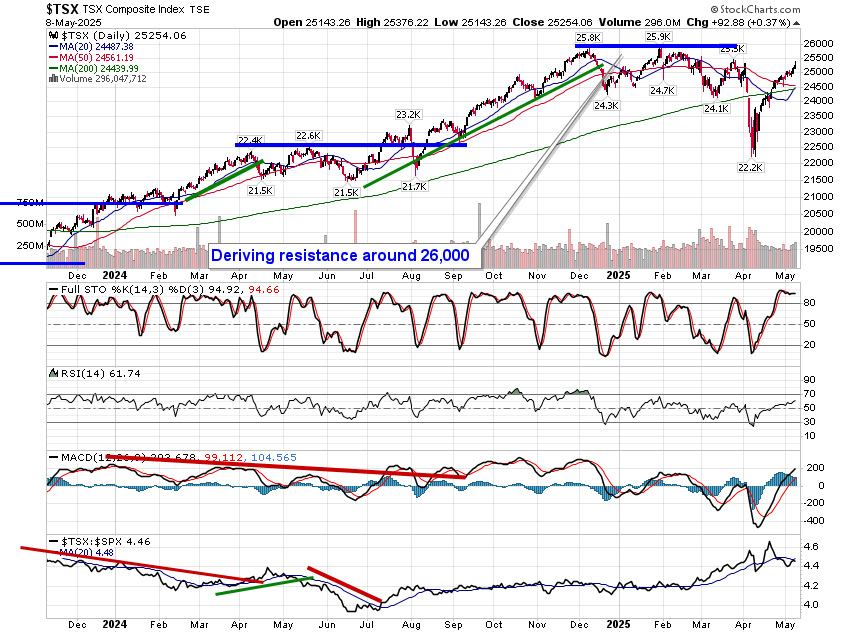
TSE Composite

| Sponsored By... |

|


