Stock Market Outlook for May 13, 2025

Breaking down the Technology sector towards those groups worthy to Accumulate during this period of seasonal strength for the sector.
*** Stocks highlighted are for information purposes only and should not be considered as advice to purchase or to sell mentioned securities. As always, the use of technical and fundamental analysis is encouraged in order to fine tune entry and exit points to average seasonal trends.
Stocks Entering Period of Seasonal Strength Today:
Subscribers Click on the relevant link to view the full profile. Not a subscriber? Signup here.

Amplify Online Retail ETF (AMEX:IBUY) Seasonal Chart

Precigen, Inc. (NASD:PGEN) Seasonal Chart
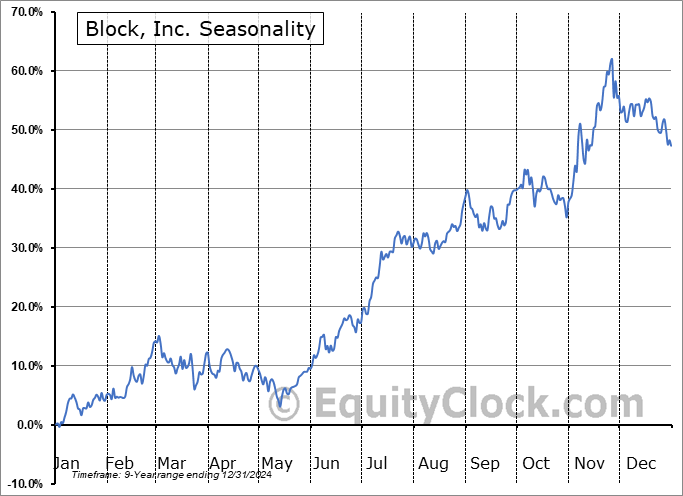
Block, Inc. (NYSE:SQ) Seasonal Chart

Arlo Technologies, Inc. (NYSE:ARLO) Seasonal Chart
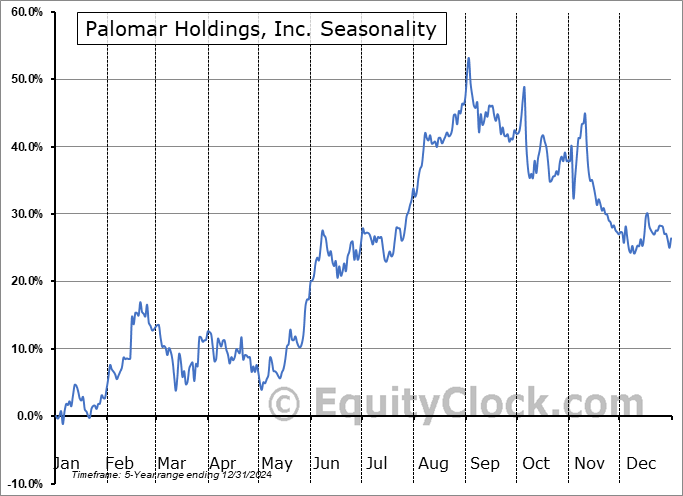
Palomar Holdings, Inc. (NASD:PLMR) Seasonal Chart

Boardwalk Equities, Inc. (TSE:BEI/UN.TO) Seasonal Chart

Skyworks Solutions Inc. (NASD:SWKS) Seasonal Chart

Altus Group Ltd. (TSE:AIF.TO) Seasonal Chart
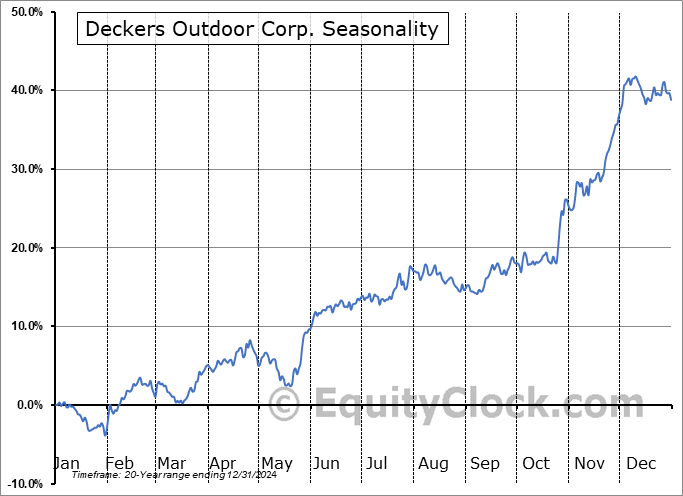
Deckers Outdoor Corp. (NYSE:DECK) Seasonal Chart

Unifirst Corp. (NYSE:UNF) Seasonal Chart

PennyMac Mortgage Investment Trust (NYSE:PMT) Seasonal Chart

Simon Property Group, Inc. (NYSE:SPG) Seasonal Chart

iShares NASDAQ 100 Index ETF (CAD-Hedged) (TSE:XQQ.TO) Seasonal Chart
The Markets
Stocks surged on Monday following the announcement of a 90-day pause on the most aggressive parts of the US tariff fight with China. The S&P 500 Index jumped by 3.26%, moving past a number of points of resistance, including the horizontal cap at 5650, as well as the 200-day moving average (5750). Coming into this session, there was an implied cap over this market in the range between 5500 and 5800 (corresponding with the span of the cloud of major moving averages that was broken in March) that required a catalyst to break (eg. progress towards a trade deal with China); this catalyst was quite obviously achieved. The benchmark is now knocking on the door of a minor point of horizontal resistance at 5850 (representing last November’s post election lows), but the big point of focus is obviously the all-time highs around 6100. The short-term trend stemming from the April low is positive, but the intermediate-term path (which is of most importance to us in our seasonal approach) remains under threat, particularly with nothing that burdened the equity market previous solved. The cloud of major moving averages (5500 to 5800) will now be looked towards to recoup levels of support, failure to do so would place the benchmark back into the threatening intermediate-term technical state that it was previous. Our list of candidates in the market to Accumulate continues to outnumber those that are worthy to Avoid, but, in the past week, we did find some areas that were worthy to downgrade as the risk of declines increase given the waning buying demand that had been apparent entering into this new week.


Want to know which areas of the market to buy or sell? Our Weekly Chart Books have just been updated, providing a clear Accumulate, Avoid, or Neutral rating for currencies, cryptocurrencies, commodities, broad markets, and subsectors/industries of the market. Subscribers can login and click on the relevant links to access.
- Currencies
- Cryptocurrencies
- Commodities
- Major Benchmarks
- Sub-sectors / Industries
- ETFs: Bonds | Commodities | Equity Markets | Industries | Sectors
Subscribe now.
Today, in our Market Outlook to subscribers, we discuss the following:
- Our weekly chart books update, along with our list of all segments of the market to either Accumulate or Avoid
- Other Notes
- Breaking down the Technology sector to those groups worthy to Accumulate during this period of seasonal strength for this market segment
- The action we are taking in the Super Simple Seasonal Portfolio with investors rotating away from former volatility hedges
Subscribers can look for this report in their inbox or by clicking on the following link and logging in: Market Outlook for May 13
Not signed up yet? Subscribe now to receive full access to all of the research and analysis that we publish.
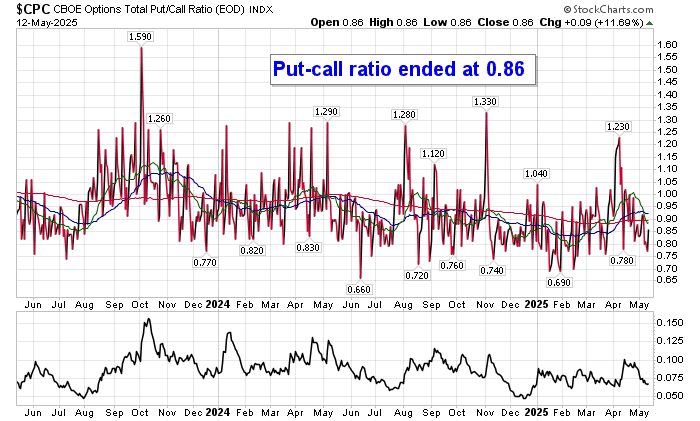
Sentiment in Monday, as gauged by the put-call ratio, ended bullish at 0.86.
Seasonal charts of companies reporting earnings today:


S&P 500 Index


TSE Composite


| Sponsored By... |

|


