Stock Market Outlook for May 15, 2025

Despite all of the volatility and wild swings in stocks this year, the performance of the S&P 500 Index is right about at the point that we expected it to be 20 weeks into this post presidential election year.
*** Stocks highlighted are for information purposes only and should not be considered as advice to purchase or to sell mentioned securities. As always, the use of technical and fundamental analysis is encouraged in order to fine tune entry and exit points to average seasonal trends.
Stocks Entering Period of Seasonal Strength Today:
Subscribers Click on the relevant link to view the full profile. Not a subscriber? Signup here.

Morgan Stanley India Investment Fund (NYSE:IIF) Seasonal Chart

JPMorgan BetaBuilders US Equity ETF (AMEX:BBUS) Seasonal Chart

PrimeEnergy Resources Corp. (NASD:PNRG) Seasonal Chart

Essential Utilities, Inc. (NYSE:WTRG) Seasonal Chart

Cohen & Steers Select Preferred & Income Fund Inc. (NYSE:PSF) Seasonal Chart

iShares India 50 ETF (NASD:INDY) Seasonal Chart

NOV Inc (NYSE:NOV) Seasonal Chart

WisdomTree India Earnings Fund (NYSE:EPI) Seasonal Chart

Chegg, Inc. (NYSE:CHGG) Seasonal Chart

MagnaChip Semiconductor Corp. (NYSE:MX) Seasonal Chart
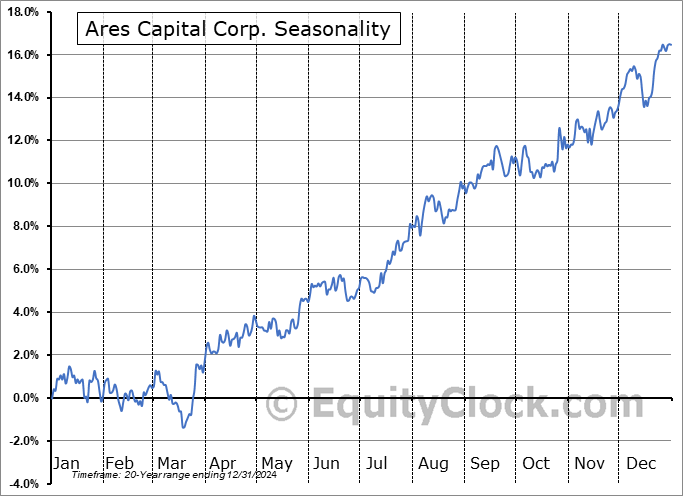
Ares Capital Corp. (NASD:ARCC) Seasonal Chart

Universal Display Corp. (NASD:OLED) Seasonal Chart

Jack Henry & Associates, Inc. (NASD:JKHY) Seasonal Chart
The Markets
Stocks closed mixed on Wednesday as the jump in stocks that started the week starts to lose steam. The S&P 500 Index closed higher by a tenth of one percent, continuing to move past a number of points of resistance, including the 200-day moving average (5750). The implied cap over this market in the range between 5500 and 5800 (corresponding with the span of the cloud of major moving averages that was broken in March) has been broken and it will now be looked to as a zone of support on a subsequent pullback. The big point of focus in the market is obviously the all-time highs around 6100, a level that is just less than 4% away. The short-term trend stemming from the April low is positive, but the intermediate-term path (which is of most importance to us in our seasonal approach) remains under threat, particularly with nothing that burdened the equity market previous adequately solved. Our list of candidates in the market to Accumulate continues to outnumber those to Avoid, but, in the past week, we did find some areas that were worthy to downgrade (eg. in the health care sector) as the risk of declines increase given the waning buying demand that had been apparent entering into this week.


Today, in our Market Outlook to subscribers, we discuss the following:
- Relative trend of Semiconductors over Software stocks; which group is more favourable to press bullish bets in
- Comparing the path of the market this year to the base case that we suggested before the year began
- The derailment of Gold and the US Dollar from post-election year seasonal norms
- The volatility beneficiary in the Financial sector that we continue to view favourably
- Investor sentiment
Subscribers can look for this report in their inbox or by clicking on the following link and logging in: Market Outlook for May 15
Not signed up yet? Subscribe now to receive full access to all of the research and analysis that we publish.
Sentiment on Wednesday, as gauged by the put-call ratio, ended overly bullish at 0.70.

Seasonal charts of companies reporting earnings today:


S&P 500 Index


TSE Composite


| Sponsored By... |

|


