Stock Market Outlook for May 16, 2025

Consumer is holding up, but are prioritizing purchases of essentials over discretionary goods.
*** Stocks highlighted are for information purposes only and should not be considered as advice to purchase or to sell mentioned securities. As always, the use of technical and fundamental analysis is encouraged in order to fine tune entry and exit points to average seasonal trends.
Stocks Entering Period of Seasonal Strength Today:
Subscribers Click on the relevant link to view the full profile. Not a subscriber? Signup here.

SoFi Select 500 ETF (AMEX:SFY) Seasonal Chart

Laurion Mineral Exploration Inc. (TSXV:LME.V) Seasonal Chart

InMode Ltd. (NASD:INMD) Seasonal Chart

Docebo Inc. (TSE:DCBO.TO) Seasonal Chart

Invesco S&P 500 Equal Weight Real Estate ETF (AMEX:RSPR) Seasonal Chart

Rafael Holdings, Inc. (NYSE:RFL) Seasonal Chart

Alamos Gold Inc. (TSE:AGI.TO) Seasonal Chart

EcoSynthetix Inc. (TSE:ECO.TO) Seasonal Chart

Invesco S&P 500 Pure Growth ETF (NYSE:RPG) Seasonal Chart
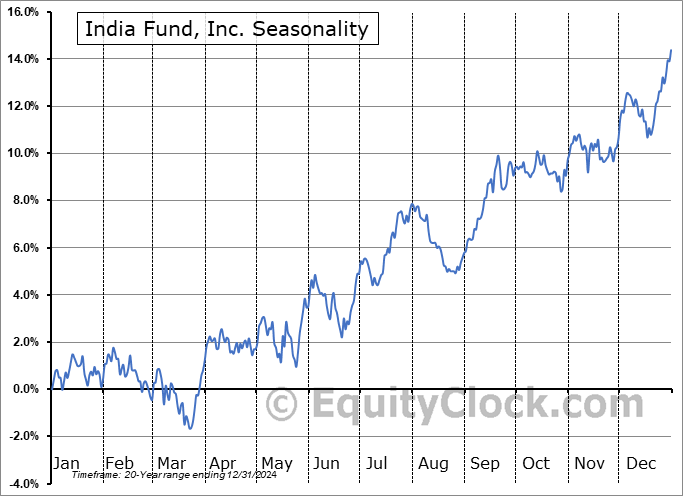
India Fund, Inc. (NYSE:IFN) Seasonal Chart

Fidelity MSCI Real Estate Index ETF (AMEX:FREL) Seasonal Chart

Vicor Corp. (NASD:VICR) Seasonal Chart

Camden National Corp. (NASD:CAC) Seasonal Chart

Colliers International Group Inc. (TSE:CIGI.TO) Seasonal Chart

Applied Optoelectronics Inc. (NASD:AAOI) Seasonal Chart

Crawford & Co. (NYSE:CRD/B) Seasonal Chart

Canadian Net Real Estate Investment Trust (TSXV:NET/UN.V) Seasonal Chart

Diversified Healthcare Trust (NASD:DHC) Seasonal Chart

Invesco S&P SmallCap 600 Pure Growth ETF (NYSE:RZG) Seasonal Chart

Jabil, Inc. (NYSE:JBL) Seasonal Chart

Consolidated Water Co. Ltd. (NASD:CWCO) Seasonal Chart

Acadia Realty Trust (NYSE:AKR) Seasonal Chart

TransDigm Group Inc. (NYSE:TDG) Seasonal Chart
The Markets
Stocks closed mildly higher on Thursday as investors started to book profits in some of the technology names that have had good runs in recent days and rotated back towards many of the defensive sectors that had been left for dead in the risk-on rally. The S&P 500 Index closed higher by four-tenths of one percent, continuing to move past a number of points of resistance, including the 200-day moving average (5750). The implied cap over this market in the range between 5500 and 5800 (corresponding with the span of the cloud of major moving averages) has been broken and it will now be looked to as a zone of support on a subsequent pullback. The big point of focus in the market is obviously the all-time highs around 6100, a level that is now around 3% away. The short-term trend stemming from the April low is positive, but the intermediate-term path (which is of most importance to us in our seasonal approach) remains under threat, particularly with nothing that burdened the equity market previous adequately solved. Our list of candidates in the market to Accumulate continues to outnumber those to Avoid, but, in the past week, we did find some areas that were worthy to downgrade (eg. in the health care sector) as the risk of declines increase given the waning buying demand that had been apparent entering into this week.


Today, in our Market Outlook to subscribers, we discuss the following:
- US Retail Sales and the investment implications within
- Retailer and Wholesaler inventories and the shift that has materialized amidst this tariff war
- Visa Spending Momentum
- Retail stocks
- The industry that is positioned well to benefit in this evolving consumer backdrop
- Investor sentiment
Subscribers can look for this report in their inbox or by clicking on the following link and logging in: Market Outlook for May 16
Not signed up yet? Subscribe now to receive full access to all of the research and analysis that we publish.
Sentiment on Thursday, as gauged by the put-call ratio, ended overly bullish at 0.70.

Seasonal charts of companies reporting earnings today:


S&P 500 Index


TSE Composite


| Sponsored By... |

|


