Stock Market Outlook for May 28, 2025

S&P 500 charts a successful gap fill, but negative seasonal tendencies on the horizon in the month of June.
*** Stocks highlighted are for information purposes only and should not be considered as advice to purchase or to sell mentioned securities. As always, the use of technical and fundamental analysis is encouraged in order to fine tune entry and exit points to average seasonal trends.
Stocks Entering Period of Seasonal Strength Today:
Subscribers Click on the relevant link to view the full profile. Not a subscriber? Signup here.

Amgen, Inc. (NASD:AMGN) Seasonal Chart

IAMGold Corp. (TSE:IMG.TO) Seasonal Chart

Exponent, Inc. (NASD:EXPO) Seasonal Chart

iShares International Treasury Bond ETF (NASD:IGOV) Seasonal Chart

iShares iBoxx $ Investment Grade Corporate Bond ETF (NYSE:LQD) Seasonal Chart

RMR Group Inc. (NASD:RMR) Seasonal Chart
The Markets
Stocks jumped to start the holiday shortened Memorial Day week following another reprieve on tariffs from the US president. The S&P 500 Index closed higher by 2.05%, moving back into the band of resistance between 5900 and 6100, effectively the all-time highs. The short-term rising trend stemming from the April lows remains that of higher-highs and higher-lows, but a break of the 50-hour moving average during the middle of last week suggests that the good times has come to an end and a digestive period heading into the end of the second quarter is likely getting underway. Upside gap support around 5700 remains the critical level to watch over the short-term timeframe given a violation of the implied level of support would lead to a resumption of the strains that the intermediate-term trend have been portraying since the start of the year; Tuesday’s jump from the gap confirms the zone as support. We continue to like the way our list of candidates in the market to Accumulate or to Avoid is positioned, although we have significantly added to our list of Avoid candidates in the past week, presenting more of a balanced view of those groups that are working and worthy to buy into against those that are struggling to achieve buying demand and are at risk of faltering through the seasonally weak period in June. On the seasonal timeline, the foreseeable threat to stocks is the mean reversion move lower that is common through the middle of June as quarter-end portfolio rebalancing is enacted. In the meantime, the Super Simple Seasonal Portfolio is effectively mitigating the stresses that have bubbled up into the market, maintaining the appropriate risk profile, even with an elevated level of equity exposure than may have normally been sought heading towards the month of June.


Want to know which areas of the market to buy or sell? Our Weekly Chart Books have just been updated, providing a clear Accumulate, Avoid, or Neutral rating for currencies, cryptocurrencies, commodities, broad markets, and subsectors/industries of the market. Subscribers can login and click on the relevant links to access.
- Currencies
- Cryptocurrencies
- Commodities
- Major Benchmarks
- Sub-sectors / Industries
- ETFs: Bonds | Commodities | Equity Markets | Industries | Sectors
Subscribe now.
Today, in our Market Outlook to subscribers, we discuss the following:
- Our weekly chart books update, along with our list of all segments of the market to either Accumulate or Avoid
- Other notes
Subscribers can look for this report in their inbox or by clicking on the following link and logging in: Market Outlook for May 28
Not signed up yet? Subscribe now to receive full access to all of the research and analysis that we publish
Sentiment on Tuesday, as gauged by the put-call ratio, ended bullish at 0.88.

Seasonal charts of companies reporting earnings today:


S&P 500 Index


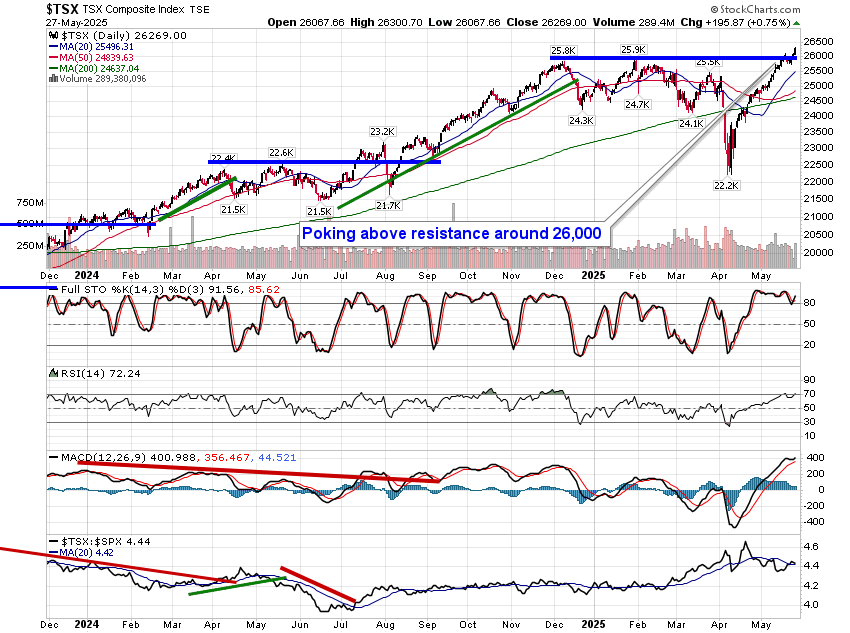
TSE Composite

| Sponsored By... |

|


