Stock Market Outlook for June 2, 2025

Over the past five decades, the S&P 500 Index has averaged a return of 0.6% June with a gain frequency of 64%.
*** Stocks highlighted are for information purposes only and should not be considered as advice to purchase or to sell mentioned securities. As always, the use of technical and fundamental analysis is encouraged in order to fine tune entry and exit points to average seasonal trends.
Stocks Entering Period of Seasonal Strength Today:
Subscribers Click on the relevant link to view the full profile. Not a subscriber? Signup here.

Marine Products Corp. (NYSE:MPX) Seasonal Chart

Hawkins Chemical, Inc. (NASD:HWKN) Seasonal Chart

iShares Expanded Tech-Software Sector ETF (NYSE:IGV) Seasonal Chart

Highway Holdings Ltd. (NASD:HIHO) Seasonal Chart
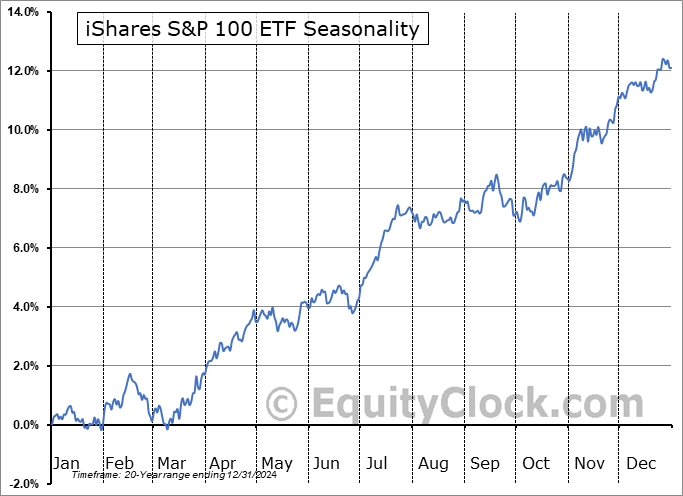
iShares S&P 100 ETF (NYSE:OEF) Seasonal Chart

TD US Equity CAD Hedged Index ETF (TSE:THU.TO) Seasonal Chart

Fidelity US High Quality Index ETF (TSE:FCUQ.TO) Seasonal Chart
The Markets
Stocks closed fairly flat in the last trading session of May as investors monitored the developments pertaining to trade and ongoing tariff uncertainty. The S&P 500 Index slipped by a mere basis point (0.01%), continuing to test the band of resistance between 5900 and 6100. The moves over the past couple of days, albeit slight, are providing hint that the short-term rising trend stemming from the April lows is coming to an end with the 50-hour moving average no longer enticing the type of buying demand that has been observed over the past month and a half; a digestive period heading into the end of the second quarter is likely underway. Upside gap support around 5700 remains the critical level to watch over the short-term timeframe given a violation of the implied level of support would lead to a resumption of the strains that the intermediate-term trend has been portraying since the start of the year. Our list of candidates in the market that are worthy to Accumulate continue to perform well and we have significantly added to our list of Avoid candidates in the past week heading towards the seasonally weak period in June.


Today, in our Market Outlook to subscribers, we discuss the following:
- Monthly look at the S&P 500 Index
- Tendencies for stocks during the month of June
- Securities that have gained or lost in every June over their trading history
- US International Trade In Goods
- Canada Gross Domestic Product (GDP) and the investment implications within
Subscribers can look for this report in their inbox or by clicking on the following link and logging in: Market Outlook for June 2
Not signed up yet? Subscribe now to receive full access to all of the research and analysis that we publish
Looking ahead, over the past five decades, the S&P 500 Index has averaged a return of 0.6% in the sixth month of the year with a gain frequency of 64%. Returns have ranged from a loss of 8.6% in June of 2008 to a gain of 6.9% in June of 2019. The average pattern for the month, based on this five decade timeframe, shows that stocks tend to hold up into the middle of the month followed by short-term weakness during the third and fourth weeks of June. We provide more insight on how to position in portfolios in our just released monthly report for June. Subscribe now.


Just Released…
Our monthly report for June is out, providing you with everything that you need to know to navigate the market through the month(s) ahead.
Highlights in this report include:
- Equity market tendencies in the month of June
- Breakout of the 30-Year Treasury Yield above the psychologically important 5% level
- US Dollar Index threatening a breakdown of its prevailing range
- Technology has had a swift rebound from the April lows, but defensive tech is where to position this summer
- Despite much volatility, the performance of the S&P 500 Index is back on track with our baseline of how the market was expected to perform this year
- Stocks that are benefiting from the wild gyrations in the market this year
- Health Care showing unhealthy technical profiles during this period of average risk aversion
- Defense set to defend portfolios this summer
- Consumers scrutinizing discretionary purchases
- Agricultural commodities in demand as food inflation perks up
- Weak Visa Spending Momentum, but still good potential in the stocks
- The first of the weakest two-week spans of the year in the equity market
- Breadth indicators have not yet crossed the threshold to suggest that the equity market is back on a sustainable rising trend
- Our list of all segments of the market to either Accumulate or Avoid, along with relevant ETFs
- Positioning for the months ahead
- Sector Reviews and Ratings
- Stocks that have Frequently Gained in the Month of June
- Notable Stocks and ETFs Entering their Period of Strength in June
Subscribers can look for this 105-page report in their inbox and, soon, in the report archive.
Not subscribed yet? Signup now to receive access to this report and all of the research that we publish.
With the new month upon us and as we celebrate the release of our monthly report for June, today we release our screen of all of the stocks that have gained in every June over their trading history. While we at Equity Clock focus on a three-pronged approach (seasonal, technical, and fundamental analysis) to gain exposure to areas of the market that typically perform well over intermediate (2 to 6 months) timeframes, we know that stocks that have a 100% frequency of success for a particular month is generally of interest to those pursuing a seasonal investment strategy. Below are the results:

And how about those securities that have never gained in this sixth month of the year, here they are:

*Note: None of the results highlighted above have the 20 years of data that we like to see in order to accurately gauge the annual recurring, seasonal influences impacting an investment, therefore the reliability of the results should be questioned. We present the above list as an example of how our downloadable spreadsheet available to yearly subscribers can be filtered. For a more extensive list of high frequency (70% ) gainers for the month of June, please refer to our monthly report.
Sentiment on Friday, as gauged by the put-call ratio, ended bullish at 0.86.

Seasonal charts of companies reporting earnings today:


S&P 500 Index


TSE Composite


| Sponsored By... |

|


