Stock Market Outlook for June 16, 2025

The first of the weakest two-week timeframes for stocks has arrived.
*** Stocks highlighted are for information purposes only and should not be considered as advice to purchase or to sell mentioned securities. As always, the use of technical and fundamental analysis is encouraged in order to fine tune entry and exit points to average seasonal trends.
Stocks Entering Period of Seasonal Strength Today:
Subscribers Click on the relevant link to view the full profile. Not a subscriber? Signup here.

iShares U.S. Healthcare ETF (NYSE:IYH) Seasonal Chart

FitLife Brands Inc. (NASD:FTLF) Seasonal Chart

BeiGene, Ltd. (NASD:BGNE) Seasonal Chart

American Eagle Outfitters, Inc. (NYSE:AEO) Seasonal Chart

First Internet Bancorp (NASD:INBK) Seasonal Chart

Arch Capt. Grp. Ltd. (NASD:ACGL) Seasonal Chart

Tyler Technologies, Inc. (NYSE:TYL) Seasonal Chart

OGE Energy Corp. (NYSE:OGE) Seasonal Chart

Intact Financial Corp. (TSE:IFC.TO) Seasonal Chart

Target Corp. (NYSE:TGT) Seasonal Chart

Expedia, Inc (NASD:EXPE) Seasonal Chart
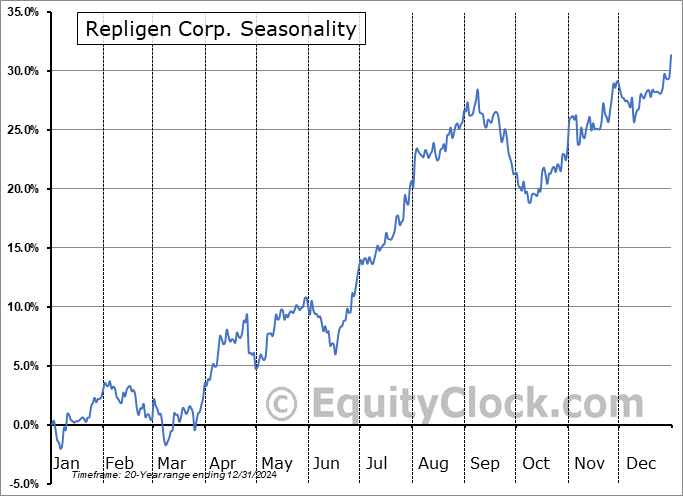
Repligen Corp. (NASD:RGEN) Seasonal Chart

Alpha and Omega Semiconductor Ltd. (NASD:AOSL) Seasonal Chart

Universal Logistics Holdings, Inc. (NASD:ULH) Seasonal Chart

Coherus BioSciences Inc. (NASD:CHRS) Seasonal Chart

iShares Global Comm Services ETF (NYSE:IXP) Seasonal Chart

Dayforce Inc. (NYSE:DAY) Seasonal Chart
The Markets
Stocks dropped on Friday as investors reacted to escalating tensions between Israel and Iran. The S&P 500 Index closed down by 1.13%, remaining within the band of resistance between 5900 and 6100. A negative divergence of MACD and RSI that has been recorded since May 20th highlights upside exhaustion, lending itself to a pullback that is quite normal, regardless of the reason, at this time of year. Support at the 20-day moving average (5944) is an important line in the sand to the short and intermediate-term trend. The 50-hour moving average that had managed to hold the rising ultra short-term trend of the market benchmark in recent days has been broken and a digestive period heading into the end of the second quarter appears to be materializing, just about on cue. The first of the two timeframes that account for the bulk of the weakness for the offseason for stocks is directly ahead running from June 14th to June 27th (see our comments below), therefore adding new risk exposure ahead of this period has not been opportune, but things look setup to provide opportunities to add risk exposure before the month concludes. Our list of candidates in the market that are worthy to Accumulate or Avoid remains appropriately positioned, keeping investors tuned into those segments of the market that are working, while highlighting those groups that are not.


Today, in our Market Outlook to subscribers, we discuss the following:
- Weekly look at the large-cap benchmark
- Crude Oil back to declining trendline resistance, perking up inflation expectations
- Junk bonds over investment grade corporates
- Significant period of risk-aversion at our doorstep
- The action we are taking in the Super Simple Seasonal Portfolio
Subscribers can look for this report in their inbox or by clicking on the following link and logging in: Market Outlook for June 16
Not signed up yet? Subscribe now to receive full access to all of the research and analysis that we publish
Sentiment on Friday, as gauged by the put-call ratio, ended bullish at 0.89.

Seasonal charts of companies reporting earnings today:


S&P 500 Index


TSE Composite


| Sponsored By... |

|


