Stock Market Outlook for June 23, 2025

Tariffs appear to be taking a toll on the normally busy spring building season.
*** Stocks highlighted are for information purposes only and should not be considered as advice to purchase or to sell mentioned securities. As always, the use of technical and fundamental analysis is encouraged in order to fine tune entry and exit points to average seasonal trends.
Stocks Entering Period of Seasonal Strength Today:
Subscribers Click on the relevant link to view the full profile. Not a subscriber? Signup here.

Stellar Biotechnologies, Inc. (NASD:EDSA) Seasonal Chart

BioNTech SE (NASD:BNTX) Seasonal Chart

Casella Waste Systems, Inc. (NASD:CWST) Seasonal Chart

Dr. Reddy’s Laboratories Ltd (NYSE:RDY) Seasonal Chart

Morningstar Inc. (NASD:MORN) Seasonal Chart

J.P. Morgan Chase & Co. (NYSE:JPM) Seasonal Chart

Stanley Black & Decker Inc. (NYSE:SWK) Seasonal Chart

ASGN Inc. (NYSE:ASGN) Seasonal Chart

Golar LNG Ltd (NASD:GLNG) Seasonal Chart

Matson, Inc. (NYSE:MATX) Seasonal Chart

Healthpeak Properties Inc (NYSE:DOC) Seasonal Chart

Power Corp. Of Canada (TSE:POW.TO) Seasonal Chart
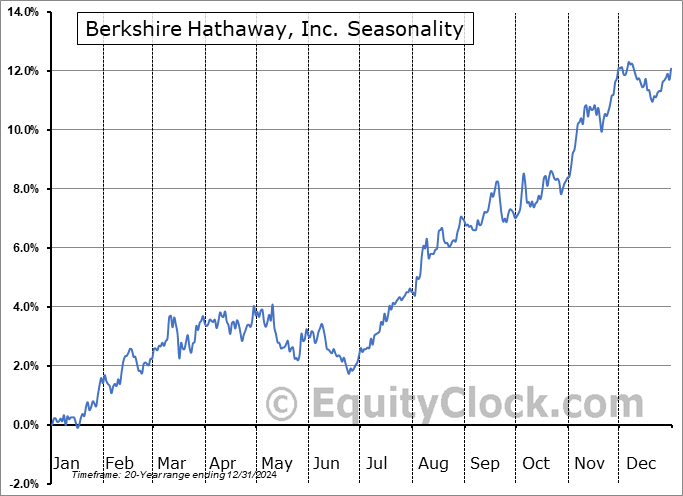
Berkshire Hathaway, Inc. (NYSE:BRK/B) Seasonal Chart

MTY Food Group Inc. (TSE:MTY.TO) Seasonal Chart

iShares U.S. Insurance ETF (NYSE:IAK) Seasonal Chart
The Markets
Stocks drifted lower on Friday in what was a quiet session bookended between the weekend and the holiday closure for Juneteenth. The S&P 500 Index closed down by just over two-tenths of one percent, continuing to react to the band of resistance between 5900 and 6100. A negative divergence of MACD and RSI that has been recorded since May 20th highlights upside exhaustion, lending itself to a pullback that is quite normal, regardless of the reason, at this time of year. Support at the 20-day moving average (5957) is an important line in the sand given that it has remained unviolated throughout the bull-market rally from the April lows. The first of the two timeframes that account for the bulk of the weakness for the offseason for stocks is upon us, running from June 14th to June 27th, therefore adding new risk exposure at this point is not opportune, but things look setup to provide opportunities to add risk exposure before the month concludes. Our list of candidates in the market that are worthy to Accumulate or Avoid remains appropriately positioned, keeping investors tuned into those segments of the market that are working, while highlighting those groups that are not.

Today, in our Market Outlook to subscribers, we discuss the following:
- Weekly look at the large-cap benchmark
- US Housing Starts and the investment implications within
- The depressed trend of Consumer Loans
- The largest increase in Home Equity Loans since 2009
- Weekly Jobless Claims and the health of the labor market
- Pessimistic business outlook
Subscribers can look for this report in their inbox or by clicking on the following link and logging in: Market Outlook for June 23
Not signed up yet? Subscribe now to receive full access to all of the research and analysis that we publish
Sentiment on Friday, as gauged by the put-call ratio, ended bullish at 0.90.

Seasonal charts of companies reporting earnings today:


S&P 500 Index


TSE Composite


| Sponsored By... |

|


