Stock Market Outlook for July 11, 2025

The abnormal decline in the US Dollar Index through the first half of the year has driven the above average gains in stocks year-to-date, but this tailwind may be fading.
*** Stocks highlighted are for information purposes only and should not be considered as advice to purchase or to sell mentioned securities. As always, the use of technical and fundamental analysis is encouraged in order to fine tune entry and exit points to average seasonal trends.
Stocks Entering Period of Seasonal Strength Today:
Subscribers Click on the relevant link to view the full profile. Not a subscriber? Signup here.

PowerFleet, Inc. (NASD:AIOT) Seasonal Chart

AdvanSix, Inc. (NYSE:ASIX) Seasonal Chart

MBIA Inc. (NYSE:MBI) Seasonal Chart

SPDR S&P Insurance ETF (NYSE:KIE) Seasonal Chart

Invesco S&P/TSX Composite Low Volatility Index ETF (TSE:TLV.TO) Seasonal Chart

Watts Water Technologies, Inc. (NYSE:WTS) Seasonal Chart

Motorola Solutions Inc. (NYSE:MSI) Seasonal Chart

Construction Partners, Inc. (NASD:ROAD) Seasonal Chart

Core Alternative ETF (AMEX:CCOR) Seasonal Chart

BMO Government Bond Index ETF (TSE:ZGB.TO) Seasonal Chart

Bicycle Therapeutics plc (NASD:BCYC) Seasonal Chart

Donaldson Co, Inc. (NYSE:DCI) Seasonal Chart

Cintas Corp. (NASD:CTAS) Seasonal Chart
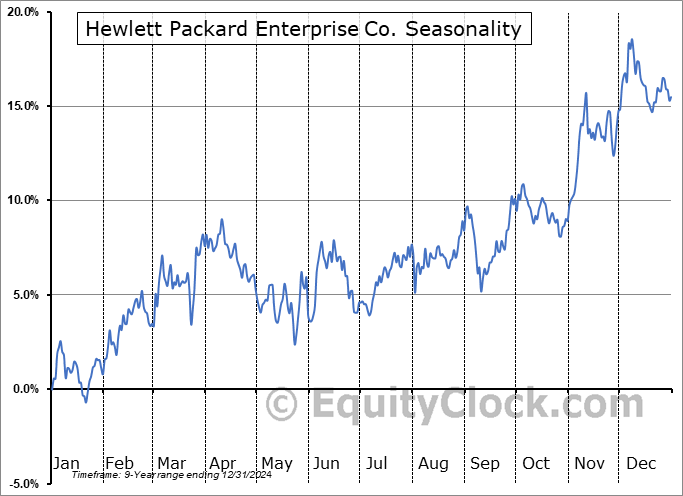
Hewlett Packard Enterprise Co. (NYSE:HPE) Seasonal Chart

Reinsurance Group of America, Inc. (NYSE:RZB) Seasonal Chart
The Markets
Stocks reached back to the record highs that were recorded prior to the Independence Day holiday as investors continue to look past concerning developments on the tariff front and focus on the positivity that this time of year is known for amidst the notorious summer rally. The S&P 500 Index ended higher by just over a quarter of one percent, punching out a fresh closing high. Support at the cloud of major moving averages remains well defined, including the 20-day moving average (6121), a variable hurdle that has been unviolated throughout the bull-market rally from the April lows. Until some of the implied levels of support start to crack, this market still has the appearance of having an easier ability to excel above levels of resistance than to fail below levels of support. While overbought signals have triggered according to various metrics in recent days, this should be viewed as a sign of strength given that market participants continue to desire putting funds to work around these heights. Our list of candidates in the market that are worthy to Accumulate or Avoid continues to be appropriately positioned, keeping investors tuned into those segments of the market that are working in such areas as in the Technology, Communication Services, Financials, and Utilities sectors.

Today, in our Market Outlook to subscribers, we discuss the following:
- The start of the period of volatility for stocks during post-election years under a new president
- The dependency on the US Dollar and interest rates
- Market is still in risk-on mode
- Weekly jobless claims and the health of the labor market
Subscribers can look for this report in their inbox or by clicking on the following link and logging in: Market Outlook for July 11
Not signed up yet? Subscribe now to receive full access to all of the research and analysis that we publish
Sentiment on Thursday, as gauged by the put-call ratio, ended bullish at 0.75.

Seasonal charts of companies reporting earnings today:
- No Significant Earnings for Today
S&P 500 Index


TSE Composite


| Sponsored By... |

|


