Stock Market Outlook for July 24, 2025

Energy product supplied just jumped to the highest level on record for the month of July.
*** Stocks highlighted are for information purposes only and should not be considered as advice to purchase or to sell mentioned securities. As always, the use of technical and fundamental analysis is encouraged in order to fine tune entry and exit points to average seasonal trends.
Stocks Entering Period of Seasonal Strength Today:
Subscribers Click on the relevant link to view the full profile. Not a subscriber? Signup here.

Limbach Holdings, Inc. (NASD:LMB) Seasonal Chart

Triumph Financial, Inc. (NASD:TFIN) Seasonal Chart

Meridian Corp. (NASD:MRBK) Seasonal Chart

SPDR Portfolio Aggregate Bond ETF (AMEX:SPAB) Seasonal Chart
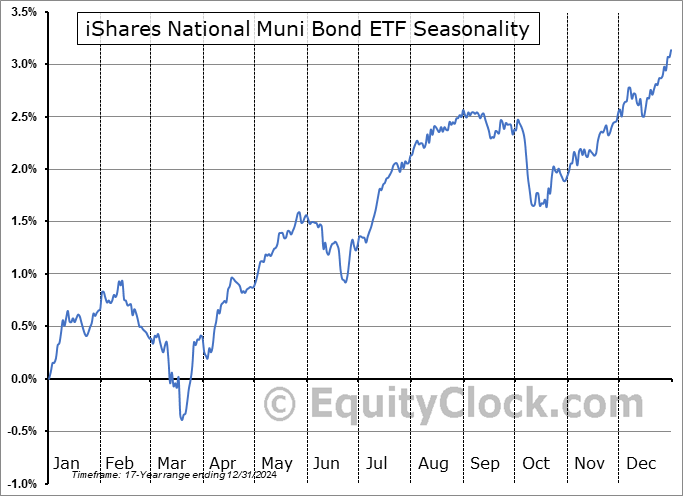
iShares National Muni Bond ETF (NYSE:MUB) Seasonal Chart

Chubb Ltd. (NYSE:CB) Seasonal Chart

iShares 7-10 Year Treasury Bond ETF (NASD:IEF) Seasonal Chart

J&J Snack Foods Corp. (NASD:JJSF) Seasonal Chart

Gentex Corp. (NASD:GNTX) Seasonal Chart

CommVault Systems Inc. (NASD:CVLT) Seasonal Chart

Cal-Maine Foods, Inc. (NASD:CALM) Seasonal Chart
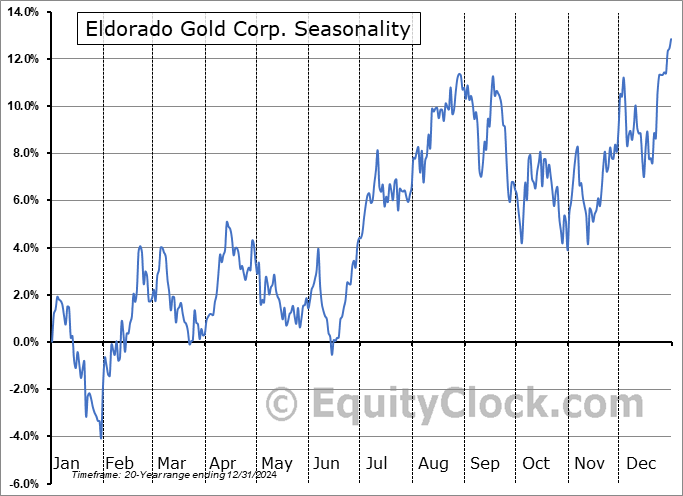
Eldorado Gold Corp. (TSE:ELD.TO) Seasonal Chart
The Markets
Stocks continue to push higher as investors react to trade deals that were announced and as the meme stock mania is re-generated. The S&P 500 Index closed higher by just less than eight-tenths of one percent, moving above the tight short-term consolidation span between 6200 and 6300; the break of the 100-point range projects a move of the same magnitude (eg. higher to 6400). The technical and seasonal backdrops provide an upside bias to that aforementioned threshold. Support at the cloud of major moving averages remains well defined, including the 20-day moving average (6245), a variable hurdle that has been unviolated throughout the bull-market rally from the April lows. Until some of the implied levels of support start to crack, this market still has the appearance of having an easier ability to excel above levels of resistance than to fail below levels of support. While overbought signals have triggered according to various metrics in recent days, this should be viewed as a sign of strength given that market participants continue to desire putting funds to work around these heights. Our list of candidates in the market that are worthy to Accumulate or Avoid continues to be appropriately positioned, keeping investors tuned into those segments of the market that are working in such areas as in the Technology, Communication Services, Financials, and Utilities sectors.

Today, in our Market Outlook to subscribers, we discuss the following:
- The return of the meme-stock mania
- New multi-month lows on the Volatility Index (VIX)
- US Existing Home Sales
- The supply and demand backdrop in the Energy market
Subscribers can look for this report in their inbox or by clicking on the following link and logging in: Market Outlook for July 24
Not signed up yet? Subscribe now to receive full access to all of the research and analysis that we publish
Sentiment on Wednesday, as gauged by the put-call ratio, ended bullish at 0.80.

Seasonal charts of companies reporting earnings today:


S&P 500 Index


TSE Composite


| Sponsored By... |

|


