Stock Market Outlook for July 31, 2025

The change in Margin Debt is providing the first hint that complacency is emerging in the equity market.
*** Stocks highlighted are for information purposes only and should not be considered as advice to purchase or to sell mentioned securities. As always, the use of technical and fundamental analysis is encouraged in order to fine tune entry and exit points to average seasonal trends.
Stocks Entering Period of Seasonal Strength Today:
Subscribers Click on the relevant link to view the full profile. Not a subscriber? Signup here.
Waste Management, Inc. (NYSE:WM) Seasonal Chart
Selective Insurance Group, Inc. (NASD:SIGI) Seasonal Chart
Black Stone Minerals LP (NYSE:BSM) Seasonal Chart
Brookfield Business Partners (NYSE:BBU) Seasonal Chart
BMO US Put Write ETF (TSE:ZPW.TO) Seasonal Chart
The Markets
Stocks gave up earlier gains on Wednesday as traders reacted to comments from Fed Chair Jerome Powell following the conclusion of the 2-day Fed meeting. The large-cap benchmark closed down by just over a tenth of one percent, peeling back slightly from the 6400 target suggested from the breakout of the short-term consolidation span between 6200 and 6300. Our speculative side has been leading us to believe that levels around the 6400 hurdle may be where the strength in stocks ends before the volatile phase in equity markets takes hold. The month of August is at our doorstep and looking for opportunities to peel back risk in portfolios has become appropriate in order to mitigate the volatility that impacts stocks in the final months of the third quarter (August/September). Support at the cloud of major moving averages remains well defined, including the 20-day moving average (6299), a variable hurdle that has been unviolated throughout the bull-market rally from the April lows. A break of some of the implied levels of support below would provide a definitive signal that the mid-year period of strength for stocks has come to an end and the notoriously erratic period for equity performance is underway. Our list of candidates in the market that are worthy to Accumulate or Avoid continues to be dialed in appropriately, keeping investors tuned into those segments of the market that are working according to our three-pronged approach incorporating seasonal, technical, and fundamental analysis.
Today, in our Market Outlook to subscribers, we discuss the following:
- The jump in Margin Debt in investor portfolios
- The trends in US Job Openings and the investment implications within
- The rollover of the Quit rate
Subscribers can look for this report in their inbox or by clicking on the following link and logging in: Market Outlook for July 31
Not signed up yet? Subscribe now to receive full access to all of the research and analysis that we publish
Sentiment on Wednesday, as gauged by the put-call ratio, ended bullish at 0.90.
Soon to be released…
We are busy placing the finishing touches on our monthly report for August, providing you with everything that you need to know to navigate this market through the month(s) ahead from a seasonal, technical, and fundamental perspective.
Subscribers can look for this extensive report in their inbox on Thursday.
Not signed up yet? Subscribe now to receive full access to all of the research and analysis that we publish
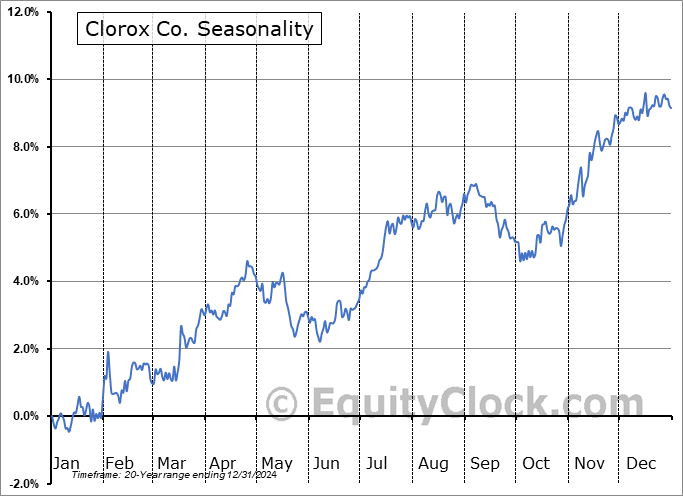
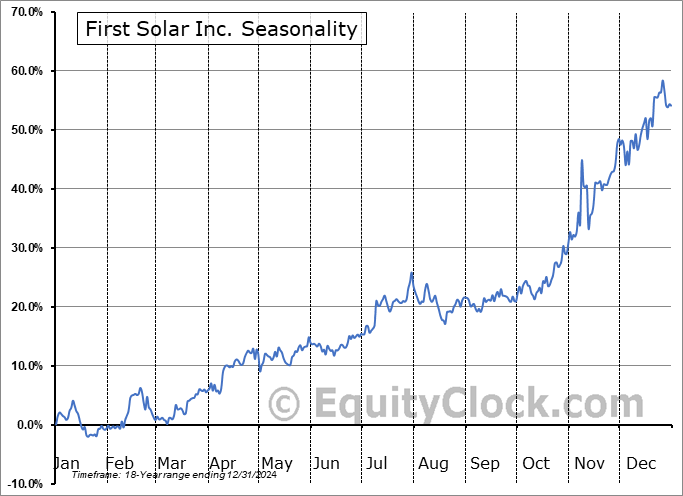
Seasonal charts of companies reporting earnings today:
S&P 500 Index
TSE Composite
| Sponsored By... |

|


