Stock Market Outlook for August 5, 2025

Stocks breaking down, VIX and bond prices breaking out.
*** Stocks highlighted are for information purposes only and should not be considered as advice to purchase or to sell mentioned securities. As always, the use of technical and fundamental analysis is encouraged in order to fine tune entry and exit points to average seasonal trends.
Stocks Entering Period of Seasonal Strength Today:
Subscribers Click on the relevant link to view the full profile. Not a subscriber? Signup here.

Cass Commercial Corp. (NASD:CASS) Seasonal Chart

Everest Group, Ltd. (NYSE:EG) Seasonal Chart

Comstock Resources, Inc. (NYSE:CRK) Seasonal Chart

Salesforce.com, Inc. (NYSE:CRM) Seasonal Chart

Visa Inc. (NYSE:V) Seasonal Chart

Best Buy Co, Inc. (NYSE:BBY) Seasonal Chart

Arch Coal, Inc. (NYSE:ARCH) Seasonal Chart

United Rentals, Inc. (NYSE:URI) Seasonal Chart

iShares Canadian Select Dividend Index ETF (TSE:XDV.TO) Seasonal Chart

CME Group Inc. (NASD:CME) Seasonal Chart
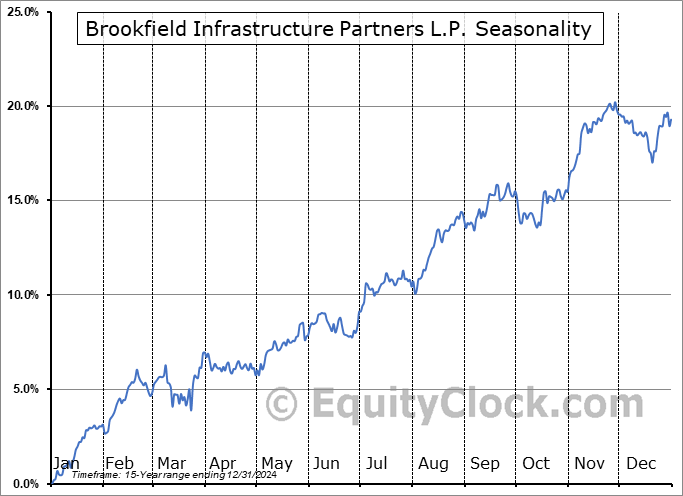
Brookfield Infrastructure Partners L.P. (TSE:BIP/UN.TO) Seasonal Chart

Air Canada (TSE:AC.TO) Seasonal Chart

Canadian Imperial Bank Of Commerce (TSE:CM.TO) Seasonal Chart

Norwegian Cruise Line Holdings Ltd. (NYSE:NCLH) Seasonal Chart

HCI Group, Inc. (NYSE:HCI) Seasonal Chart

Vistra Energy Corp. (NYSE:VST) Seasonal Chart
Note: Monday is a Civic Holiday and, as a result, our next report will be released on Tuesday. Our weekly chart books will be updated, as per usual, on Sunday. Have a great long weekend!
The Markets
Stocks traded firmly lower on Friday following a disappointing read of payroll growth for July and the implementation of tariffs from the US following the recent pause of the import tax. The large-cap benchmark closed down by 1.60%, following through to the downside from the reversal candlestick at the 6400 target that was charted on Thursday. Our speculative side has been leading us to believe that levels around the 6400 hurdle may be where the strength in stocks ends before the volatile phase in equity markets takes hold and, so far, this is proving to be correct. The month of August is upon us and looking for opportunities to peel back risk in portfolios has become appropriate in order to mitigate the volatility that impacts stocks in the final months of the third quarter (August/September). Support at the cloud of major moving averages is under threat given the violation of the 20-day moving average (6302) , a variable hurdle that had supported the bull-market rally from the April lows. A definitive signal of the conclusion of the mid-year period of strength for stocks has been achieved and the notoriously erratic period for equity performance is underway. The next level to scrutinize is previous resistance at the February high around 6150 (approximately equivalent to the 50-day moving average) as a violation here would raise questions as to the legitimacy of the breakout in prices to fresh all-time highs through the summer rally period in July. Our list of candidates in the market that are worthy to Accumulate or Avoid continues to be dialed in appropriately, keeping investors tuned into those segments of the market that are working according to our three-pronged approach incorporating seasonal, technical, and fundamental analysis.

Today, in our Market Outlook to subscribers, we discuss the following:
- Weekly look at the large-cap index and the levels of significance to scrutinize
- Breakout of bond prices and the action we are taking in the Super Simple Seasonal Portfolio
- The divergence that Gamma Exposure was showing prior to Friday’s downfall in equity prices
- US Employment Situation and the investment implications within
- The change in average hourly earnings
Subscribers can look for this report in their inbox or by clicking on the following link and logging in: Market Outlook for August 5
Not signed up yet? Subscribe now to receive full access to all of the research and analysis that we publish
Sentiment on Friday, as gauged by the put-call ratio, ended slightly bullish at 0.92.

Just Released…
Our monthly report for August is out, providing you with everything that you need to know to navigate the market through the month(s) ahead.
Highlights in this report include:
- Equity market tendencies in the month of August
- Trading the period of seasonal volatility ahead
- Gold
- Start of the optimal holding period for the bond market
- Scrutinizing the credit market
- Junk bonds over treasuries
- Other cues to signal the shift to the start of period of volatility for stocks
- Reviewing the playbook for the equity market from here
- Fading strength in Industrial Production
- Playing Defense
- Beacon of light surrounding the Artificial Intelligence (AI) trade
- Hot summer placing pressure on the electrical grid
- Inflationary pressures subdued through H1, but upside risks in H2 can be seen
- Fundamentals to insurance stocks remain strong
- Our list of all segments of the market to either Accumulate or Avoid, along with relevant ETFs
- Positioning for the months ahead
- Sector Reviews and Ratings
- Stocks that have Frequently Gained in the Month of August
- Notable Stocks and ETFs Entering their Period of Strength in August
Subscribers can look for this 95-page report in their inbox and in the report archive.
Not subscribed yet? Signup now to receive access to this report and all of the research that we publish.
Seasonal charts of companies reporting earnings today:


S&P 500 Index


TSE Composite


| Sponsored By... |

|


