Stock Market Outlook for August 8, 2025

Health Care is certainly not working at this seasonally favourable time of year, but many other groups are, providing a hedge against the notorious third quarter volatility in the equity market.
*** Stocks highlighted are for information purposes only and should not be considered as advice to purchase or to sell mentioned securities. As always, the use of technical and fundamental analysis is encouraged in order to fine tune entry and exit points to average seasonal trends.
Stocks Entering Period of Seasonal Strength Today:
Subscribers Click on the relevant link to view the full profile. Not a subscriber? Signup here.

Pacer Fund Trust Pacer Trendpilot US Large Cap ETF (AMEX:PTLC) Seasonal Chart

Cabaletta Bio Inc. (NASD:CABA) Seasonal Chart

Ranger Energy Services, Inc. (NYSE:RNGR) Seasonal Chart

Rogers Communications, Inc. (TSE:RCI/A.TO) Seasonal Chart
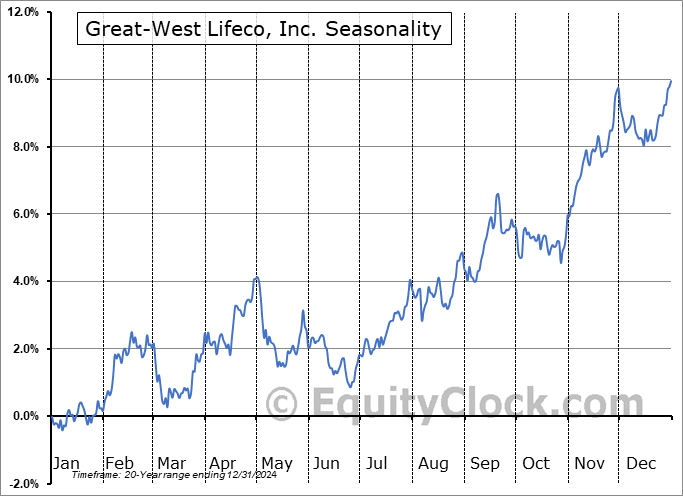
Great-West Lifeco, Inc. (TSE:GWO.TO) Seasonal Chart

United States Copper Fund (AMEX:CPER) Seasonal Chart

iShares Commodities Select Strategy ETF (NASD:COMT) Seasonal Chart

iShares Core S&P/TSX Composite High Dividend Index ETF (TSE:XEI.TO) Seasonal Chart

Saga Communications, Inc. (NASD:SGA) Seasonal Chart

Generac Holdings Inc. (NYSE:GNRC) Seasonal Chart

AMERISAFE, Inc. (NASD:AMSF) Seasonal Chart

Renaissance RE Holdings Ltd. (NYSE:RNR) Seasonal Chart
The Markets
Another reversal session for the S&P 500 Index emphasizes the buying exhaustion that has been revealed around the recent hieghts. The S&P 500 Index closed down by nearly a tenth of one percent, continuing to gyrate around the 20-day moving average that was broken on Friday. Our speculative side has been leading us to believe that levels around the 6400 hurdle may be where the strength in stocks ends before the volatile phase in equity markets takes hold and, so far, this is proving to be correct. A gap fill around 6350 continues to evolve following Friday’s abrupt downfall in prices, but no meaningful resumption of the upside trajectory has been achieved. Momentum indicators are rolling over from the most overbought levels since July of 2024, just prior to the volatility shock that evolved rapidly through the first week of August of last year. This is the time of year to be on your toes given that August is upon us, a well known volatile period that sees equity markets destabilize from their summer strength; looking for opportunities to peel back risk in portfolios has become appropriate in order to mitigate the erratic moves that impacts stocks in the final months of the third quarter (August/September). A good level to scrutinize on the downside is previous resistance at the February high around 6150 (approximately equivalent to the 50-day moving average) as a violation here would raise questions as to the legitimacy of the breakout in prices to fresh all-time highs through the summer rally period in July. Our list of candidates in the market that are worthy to Accumulate or Avoid continues to be dialed in appropriately, keeping investors tuned into those segments of the market that are working according to our three-pronged approach incorporating seasonal, technical, and fundamental analysis.

Today, in our Market Outlook to subscribers, we discuss the following:
- Health Care sector at 52-week lows
- “A market that is vulnerable to third quarter volatility calls for hedges”
- US Wholesale Trade
- Weekly Jobless Claims and the health of the labor market
Subscribers can look for this report in their inbox or by clicking on the following link and logging in: Market Outlook for August 8
Not signed up yet? Subscribe now to receive full access to all of the research and analysis that we publish
Sentiment on Thursday, as gauged by the put-call ratio, ended bullish at 0.79.

Seasonal charts of companies reporting earnings today:


S&P 500 Index


TSE Composite


| Sponsored By... |

|


