Stock Market Outlook for September 8, 2025

Further evidence of economic degradation presses the need for fixed income exposure in portfolios.
*** Stocks highlighted are for information purposes only and should not be considered as advice to purchase or to sell mentioned securities. As always, the use of technical and fundamental analysis is encouraged in order to fine tune entry and exit points to average seasonal trends.
Stocks Entering Period of Seasonal Strength Today:
Subscribers Click on the relevant link to view the full profile. Not a subscriber? Signup here.

Fidelity Stocks for Inflation ETF (AMEX:FCPI) Seasonal Chart

Columbia Financial Inc. (NASD:CLBK) Seasonal Chart

Bath & Body Works, Inc. (NYSE:BBWI) Seasonal Chart
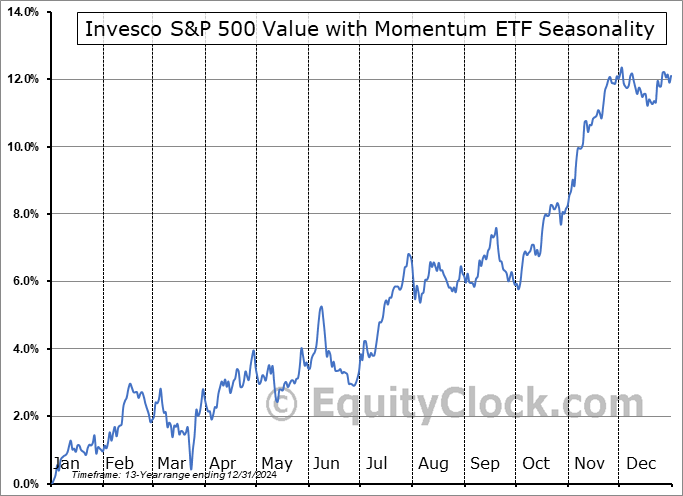
Invesco S&P 500 Value with Momentum ETF (AMEX:SPVM) Seasonal Chart

Invesco DWA Financial Momentum ETF (NASD:PFI) Seasonal Chart

KLA Corp. (NASD:KLAC) Seasonal Chart

VSE Corp. (NASD:VSEC) Seasonal Chart

eHealth Inc. (NASD:EHTH) Seasonal Chart

Ingersoll Rand Inc (NYSE:IR) Seasonal Chart

iShares Core Dividend Growth ETF (AMEX:DGRO) Seasonal Chart

Invesco KBW Regional Banking ETF (NASD:KBWR) Seasonal Chart

Summit Materials Inc. (NYSE:SUM) Seasonal Chart

Point Bridge GOP Stock Tracker ETF (AMEX:MAGA) Seasonal Chart

Zymeworks Inc. (NASD:ZYME) Seasonal Chart

Mesa Laboratories, Inc. (NASD:MLAB) Seasonal Chart

Simpson Mfg Co, Inc. (NYSE:SSD) Seasonal Chart

BP Amoco PLC (NYSE:BP) Seasonal Chart

AT&T, Inc. (NYSE:T) Seasonal Chart

Invesco S&P SmallCap Industrials ETF (NASD:PSCI) Seasonal Chart

SPDR S&P Retail ETF (NYSE:XRT) Seasonal Chart

Invesco S&P SmallCap Financials ETF (NASD:PSCF) Seasonal Chart

Defiance Quantum ETF (NASD:QTUM) Seasonal Chart

Robert Half Intl, Inc. (NYSE:RHI) Seasonal Chart

Toro Co. (NYSE:TTC) Seasonal Chart

Winnebago Industries Inc. (NYSE:WGO) Seasonal Chart

Synchrony Financial (NYSE:SYF) Seasonal Chart
The Markets
Stocks reversed on Friday, closing down on the session, as a much weaker than expected read of employment raised concerns pertaining to the health of the economy. The S&P 500 Index ended down by just less than a third of one percent, holding above short-term support around the 20-day moving average (6444), but showing struggle to achieve incremental new buyers around the 6500 zone. Momentum indicators are still showing negative divergences versus price where lower-highs below July’s overbought extremes have been charted for RSI and MACD. The result gives strong evidence of buying exhaustion, once again lending itself to the onset of a digestion of prices aligning with the period of volatility for the equity market. As has been emphasized, this is the time to be on your toes given the well known volatile period that this time of year is notorious for. As equity markets destabilize from their summer strength, looking for opportunities to peel back risk in portfolios has become appropriate in order to mitigate the erratic moves that impacts stocks in the final months of the third quarter (August/September). The strategy remains to avoid being aggressive in risk (stocks) in the near-term, but take advantage of any volatility shocks (should they materialize) to increase the risk profile of portfolios ahead of the best six months of the year for stocks that gets underway in October. Our list of candidates in the market that are worthy to Accumulate or Avoid continues to be dialed in appropriately, keeping investors tuned into those segments of the market that are working according to our three-pronged approach incorporating seasonal, technical, and fundamental analysis.

Today, in our Market Outlook to subscribers, we discuss the following:
- Weekly look at the large-cap benchmark
- US Employment Situation and the investment implications within
- Canada Labour Force Survey and what the trends mean for your portfolio
- Canadian Dollar
- Investor sentiment
Subscribers can look for this report in their inbox or by clicking on the following link and logging in: Market Outlook for September 8
Not signed up yet? Subscribe now to receive full access to all of the research and analysis that we publish
Sentiment on Friday, as gauged by the put-call ratio, ended bullish at 0.72.

Seasonal charts of companies reporting earnings today:


S&P 500 Index


TSE Composite


| Sponsored By... |

|


