Stock Market Outlook for October 27, 2025

Today marks the average start to the best six months of the year timeframe for the equity market.
*** Stocks highlighted are for information purposes only and should not be considered as advice to purchase or to sell mentioned securities. As always, the use of technical and fundamental analysis is encouraged in order to fine tune entry and exit points to average seasonal trends.
Stocks Entering Period of Seasonal Strength Today:
Subscribers Click on the relevant link to view the full profile. Not a subscriber? Signup here.

iShares Exponential Technologies ETF (NASD:XT) Seasonal Chart

Ball Corp. (NYSE:BALL) Seasonal Chart

iShares U.S. Broker-Dealers & Securities Exchanges ETF (NYSE:IAI) Seasonal Chart

BioMarin Pharmaceutical, Inc. (NASD:BMRN) Seasonal Chart

Comcast Corp. (NASD:CMCSA) Seasonal Chart

Hormel Foods Corp. (NYSE:HRL) Seasonal Chart

Innospec, Inc. (NASD:IOSP) Seasonal Chart

MaxLinear Inc. (NASD:MXL) Seasonal Chart

Agilent Technologies, Inc. (NYSE:A) Seasonal Chart

iShares U.S. Healthcare Providers ETF (NYSE:IHF) Seasonal Chart

Invesco S&P 500 Equal Weight Industrials ETF (NYSE:RSPN) Seasonal Chart

VanEck Vectors Semiconductor ETF (NASD:SMH) Seasonal Chart

QUALCOMM Inc. (NASD:QCOM) Seasonal Chart

Marvell Technology Inc (NASD:MRVL) Seasonal Chart

Old Dominion Freight Line, Inc. (NASD:ODFL) Seasonal Chart

Hologic, Inc. (NASD:HOLX) Seasonal Chart

Trane Technologies Inc (NYSE:TT) Seasonal Chart

Nucor Corp. (NYSE:NUE) Seasonal Chart

Martin Marietta Materials (NYSE:MLM) Seasonal Chart
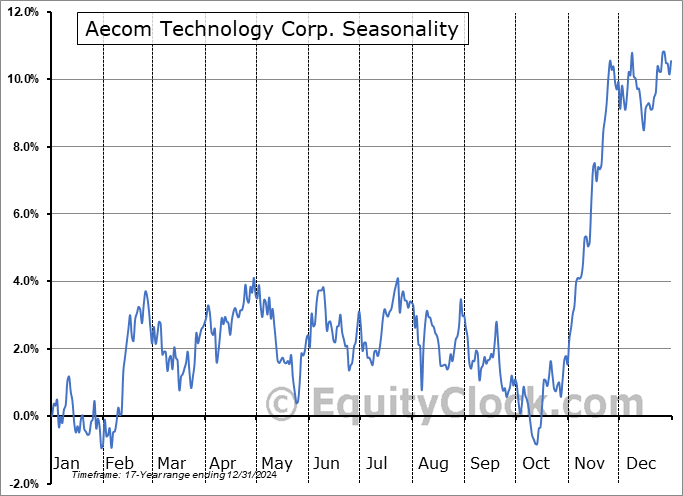
Aecom Technology Corp. (NYSE:ACM) Seasonal Chart

Fastenal Co. (NASD:FAST) Seasonal Chart
The Markets
Stocks moved up to end the week as a tamer than expected read of inflation had traders reaching out on the risk spectrum. The large-cap benchmark added almost eight-tenths of one percent, elevating above the 20-day moving average (~6697). The variable hurdle had kept the short-term trend off of the April lows intact. The 50-day moving average (6595) has so far mitigated a more serious downfall as the pullback that many are hoping for in order to add to risk exposure for the end of the year fails to produce results of significance. The trends of both the volatility index and the US Dollar remain positively sloped, aligned with seasonal norms, as investors remain on edge, providing a headwind to contend with. The suggestion continues that the market may not be in the clear toward broad risk exposure, yet. October is the time of year when fear/volatility hit a peak and the month is showing this unsettled state. While at the doorstep to the best six months of the year for stocks, it remains difficult to advocate being aggressive in broad risk (stocks) exposure, yet, with the exception of highlighted Accumulate candidates in our Accumulate/Avoid list. The desire remains to take advantage of any volatility shocks to increase the risk profile of portfolios in the days ahead. Our list of candidates in the market that are worthy to Accumulate or Avoid continues to show far more ideas worthy to buy than to sell, but we will continue to allow for the possibility of volatility to ramp up through the days/weeks ahead and position the risk metrics of portfolios appropriately until a more ideal setup to reach out on the risk spectrum (eg. away from bonds/gold and towards our four desired sectors) is revealed.

Today, in our Market Outlook to subscribers, we discuss the following:
- Weekly look at the large-cap benchmark
- Start of the best six months of the year timeframe for stocks (today)
- Four sectors continue to warrant our attention in portfolio positioning, but another sector has caught our eye as the next Accumulate candidate
- US Consumer Price Index (CPI) and the investment implications within
Subscribers can look for this report in their inbox or by clicking on the following link and logging in: Market Outlook for October 27
Not signed up yet? Subscribe now to receive full access to all of the research and analysis that we publish
Sentiment on Friday, as gauged by the put-call ratio, ended bullish at 0.82.

Seasonal charts of companies reporting earnings today:


S&P 500 Index


TSE Composite


| Sponsored By... |

|


