Stock Market Outlook for November 3, 2025

The S&P 500 Index has averaged a return of 2.1% in November over the past 50 years with 74% of periods showing a positive result.
*** Stocks highlighted are for information purposes only and should not be considered as advice to purchase or to sell mentioned securities. As always, the use of technical and fundamental analysis is encouraged in order to fine tune entry and exit points to average seasonal trends.
Stocks Entering Period of Seasonal Strength Today:
Subscribers Click on the relevant link to view the full profile. Not a subscriber? Signup here.

Corning, Inc. (NYSE:GLW) Seasonal Chart

Invesco KBW High Dividend Yield Financial ETF (NASD:KBWD) Seasonal Chart

STMicroelectronics NV (NYSE:STM) Seasonal Chart

Federal Signal Corp. (NYSE:FSS) Seasonal Chart

IPG Photonics Corp. (NASD:IPGP) Seasonal Chart

Commercial Metals Co. (NYSE:CMC) Seasonal Chart

AAON, Inc. (NASD:AAON) Seasonal Chart

Microchip Technology Inc. (NASD:MCHP) Seasonal Chart

Datadog Inc. (NASD:DDOG) Seasonal Chart

Bristol Myers Squibb Co. (NYSE:BMY) Seasonal Chart

Magna Intl, Inc. (TSE:MG.TO) Seasonal Chart

Cargojet Inc. (TSE:CJT.TO) Seasonal Chart

Masco Corp. (NYSE:MAS) Seasonal Chart

Vanguard Value ETF (NYSE:VTV) Seasonal Chart

Dover Corp. (NYSE:DOV) Seasonal Chart
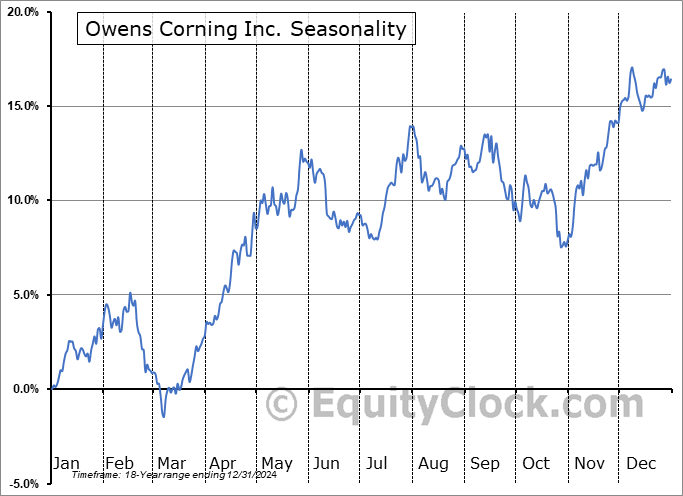
Owens Corning Inc. (NYSE:OC) Seasonal Chart

Penn National Gaming, Inc. (NASD:PENN) Seasonal Chart

Jazz Pharmaceuticals, Inc. (NASD:JAZZ) Seasonal Chart

Lennar Corp. (NYSE:LEN) Seasonal Chart

International Paper Co. (NYSE:IP) Seasonal Chart
The Markets
Stocks closed modestly higher to end the week and the month as opposing forces of a strong reaction to earnings from Amazon (AMZN) and growing headwinds from the US Dollar kept stocks at bay. The S&P 500 Index ended higher by just over a quarter of one percent, finding near-term support in the range of the October 27th upside open gap between 6807 and 6843. Another upside gap charted on October 24th between 6749 and 6772 has gone unfilled, thus far, presenting a subsequent zone of short-term support that the bulls are likely to use to shoot bets against. The 50-day moving average (6640) has so far mitigated a more serious downfall as the pullback that many were hoping for in order to add to risk exposure for the end of the year fails to produce results of significance. While benchmarks are showing greater evidence of support than resistance, a backdrop that warrants a positive view of the market, breadth is becoming increasingly poor, leaving few players in this market to perform the heavy lifting heading into the start of the best six months of the year performance for stocks. The result contributes to our rather unsettled position that we are burdened by. While the segments of the market that we continue to target in our weekly chart books remain correctly dialed in, we have been hesitant to signal the all-clear towards broader risk exposure, as has historically been easy to do at this time of year. October is the time of year when fear/volatility hit a peak and buying into the unease is typically the prudent approach. Last year, the “all-clear” signal was revealed at the start of November and we were subsequently forced to reign in risk around the start of February ahead of the equity market pullback that denied a positive outcome to the best six month trade last year. For now, we continue to lean on our list of candidates in the market that are worthy to Accumulate or Avoid, which continues to show far more ideas worthy to buy than to sell, but advocating to increase portfolio sensitivity to the broader market at this point, aligned with the average start to the best six months of the year performance, is difficult to do. The more ideal entry points for an intermediate-term (multi-month) holding period can be pegged around rising 20-week moving averages, which major market benchmarks are stretched well above. This is not negative, but rather less than ideal to assure that we’re ramping up equity exposure at preferable risk-reward points.

Today, in our Market Outlook to subscribers, we discuss the following:
- Monthly look at at the large-cap benchmark
- Tendency for stocks in the month of November
- Securities that have gained or lost in every November over their trading history
- Canada Gross Domestic Product (GDP), the significant downward revisions to early-year data, and the investment implications within
Subscribers can look for this report in their inbox or by clicking on the following link and logging in: Market Outlook for November 3
Not signed up yet? Subscribe now to receive full access to all of the research and analysis that we publish
Looking ahead, as the best six months for stocks begins, November provides a good jump out of the gate. The S&P 500 Index has averaged a return of 2.1% in this second to last month of the year over the past 50 years. The result is the strongest average monthly return of the year. The frequency of positive results for the month sits at 74%. Returns have ranged from a loss of 8.5% in November of 1987 to a gain of 10.8% in November of 2020. We provide more insight in our just released monthly report for November. Subscribers can look for this report in their inbox or in the archive at https://charts.equityclock.com/


Just Released…
Our monthly report for November is out, providing you with everything that you need to know to navigate the market through the month(s) ahead.
Highlights in this report include:
- Equity market tendencies in the month of November
- Gold losing its shine?
- Abnormal September gains in resource employment in Canada
- The precious metal that is showing an emerging rising trend
- Utilities employment flourishing
- Shocking downward revisions to consumer loan activity suggesting a recessionary state
- Credit Card Loan activity on the decline
- Decline of Business Loans
- REITs
- Traders seem fairly content with where the short-term lending rate is
- Bonds
- Becoming attracted to emerging market exposure
- The fuel source to the rally in stocks from the last five years is running low
- Plotting this year’s market performance against post-election year norms
- Our list of all segments of the market to either Accumulate or Avoid, along with relevant ETFs
- Positioning for the months ahead
- Sector Reviews and Ratings
- Stocks that have Frequently Gained in the Month of November
- Notable Stocks and ETFs Entering their Period of Strength in November
Subscribers can look for this 116-page report in their inbox and in the report archive.
Not signed up yet? Subscribe now to receive full access to all of the research and analysis that we publish
With the new month upon us and as we celebrate the release of our monthly report for November, today we release our screen of all of the stocks that have gained in every November over their trading history. While we at Equity Clock focus on a three-pronged approach (seasonal, technical, and fundamental analysis) to gain exposure to areas of the market that typically perform well over intermediate (2 to 6 months) timeframes, we know that stocks that have a 100% frequency of success for a particular month is generally of interest to those pursuing a seasonal investment strategy. Below are the results:

And how about those securities that have never gained in this eleventh month of the year, here they are:

*Note: None of the results highlighted above have the 20 years of data that we like to see in order to accurately gauge the annual recurring, seasonal influences impacting an investment, therefore the reliability of the results should be questioned. We present the above list as an example of how our downloadable spreadsheet available to yearly subscribers can be filtered. For a more extensive list of high frequency (70% ) gainers for the month of October, please refer to our monthly report.
Sentiment on Friday, as gauged by the put-call ratio, ended bullish at 0.79.

Seasonal charts of companies reporting earnings today:


S&P 500 Index


TSE Composite


| Sponsored By... |

|


