Stock Market Outlook for November 10, 2025

Looking at November 20th as a potentially important day to buy stocks.
*** Stocks highlighted are for information purposes only and should not be considered as advice to purchase or to sell mentioned securities. As always, the use of technical and fundamental analysis is encouraged in order to fine tune entry and exit points to average seasonal trends.
Stocks Entering Period of Seasonal Strength Today:
Subscribers Click on the relevant link to view the full profile. Not a subscriber? Signup here.

Slate Grocery REIT (TSE:SGR/UN.TO) Seasonal Chart

SPDR SSGA Global Allocation ETF (AMEX:GAL) Seasonal Chart

Alaris Equity Partners Income Trust (TSE:AD/UN.TO) Seasonal Chart

Vanguard Small-Cap Value ETF (NYSE:VBR) Seasonal Chart

Invesco S&P 500 Equal Weight ETF (NYSE:RSP) Seasonal Chart

Invesco S&P 500 Equal Weight Financials ETF (NYSE:RSPF) Seasonal Chart

iShares U.S. Infrastructure ETF (AMEX:IFRA) Seasonal Chart

Ag Growth International Inc. (TSE:AFN.TO) Seasonal Chart

AutoCanada Inc. (TSE:ACQ.TO) Seasonal Chart

TC Energy Corporation (TSE:TRP.TO) Seasonal Chart

Oshkosh Corp. (NYSE:OSK) Seasonal Chart

SPDR S&P 400 Mid Cap Value ETF (NYSE:MDYV) Seasonal Chart

iShares MSCI Japan ETF (NYSE:EWJ) Seasonal Chart

iShares Russell 2000 Growth ETF (NYSE:IWO) Seasonal Chart

SPDR S&P Homebuilders ETF (NYSE:XHB) Seasonal Chart

Pacer Benchmark Industrial ETF (AMEX:INDS) Seasonal Chart

Lowes Companies, Inc. (NYSE:LOW) Seasonal Chart
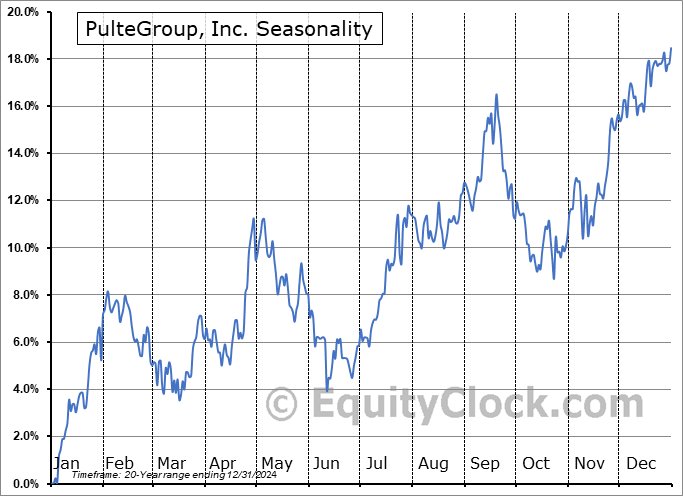
PulteGroup, Inc. (NYSE:PHM) Seasonal Chart

J.B. Hunt Transport Services, Inc. (NASD:JBHT) Seasonal Chart

Home Depot, Inc. (NYSE:HD) Seasonal Chart

ProShares Online Retail ETF (AMEX:ONLN) Seasonal Chart

Snap Inc. (NYSE:SNAP) Seasonal Chart

Texas Instruments, Inc. (NASD:TXN) Seasonal Chart

iShares MSCI Europe Small-Cap ETF (NASD:IEUS) Seasonal Chart

KB Home (NYSE:KBH) Seasonal Chart
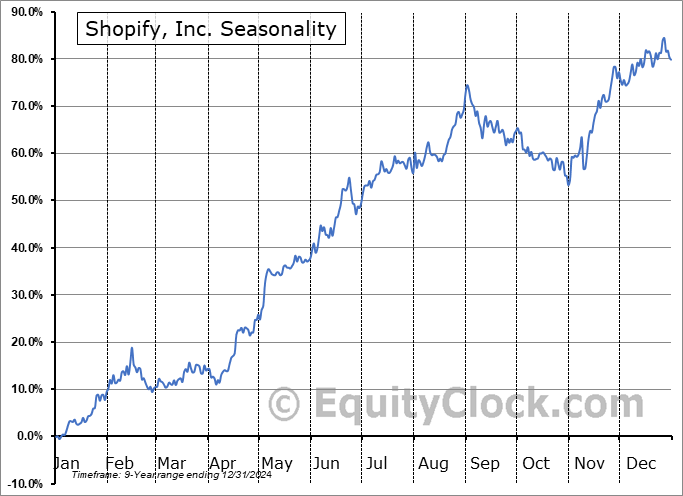
Shopify, Inc. (NYSE:SHOP) Seasonal Chart
The Markets
Stocks closed marginally higher on Friday as traders lifted markets off their lows amidst uncertainty over whether the government shutdown in the US may be resolved in the days ahead. The S&P 500 Index closed higher by just over a tenth of one percent , maintaining the gaps charted through the end of October as resistance. The island reversal pattern charted this week has threatened the potential shift of the prevailing trend. The 50-day moving average (6670), tested at the lows of the day, continues to be a very important line in the sand for the market, so far mitigating a more serious downfall. Breadth in the market remains poor, leaving few players in this market to perform the heavy lifting heading into the start of the best six months of the year performance for stocks. The result contributes to our rather unsettled position that we are burdened by. We have been hesitant to signal the all-clear towards broader risk exposure, as has historically been easy to do at this time of year. For now, we continue to lean on our list of candidates in the market that are worthy to Accumulate or Avoid, which continues to show far more ideas worthy to buy than to sell, but advocating to increase portfolio sensitivity to the broader market at this point, aligned with the average start to the best six months of the year performance, is difficult to do.


Today, in our Market Outlook to subscribers, we discuss the following:
- Weekly look at the large-cap benchmark
- The important date to lookout for to buy stocks
- Net New Highs on the NYSE showing characteristics of a corrective pattern in stocks
- Canada Labour Force Survey and the investment implications within
- Canadian Dollar
Subscribers can look for this report in their inbox or by clicking on the following link and logging in: Market Outlook for November 10
Not signed up yet? Subscribe now to receive full access to all of the research and analysis that we publish
Sentiment on Friday, as gauged by the put-call ratio, ended neutral at 0.98.

Seasonal charts of companies reporting earnings today:


S&P 500 Index


TSE Composite


| Sponsored By... |

|


