Stock Market Outlook for November 25, 2025

The next six weeks has historically been one of the strongest periods of the year for stocks.
*** Stocks highlighted are for information purposes only and should not be considered as advice to purchase or to sell mentioned securities. As always, the use of technical and fundamental analysis is encouraged in order to fine tune entry and exit points to average seasonal trends.
Stocks Entering Period of Seasonal Strength Today:
Subscribers Click on the relevant link to view the full profile. Not a subscriber? Signup here.

Bridgford Foods Corp. (NASD:BRID) Seasonal Chart

Hershey Foods Corp. (NYSE:HSY) Seasonal Chart
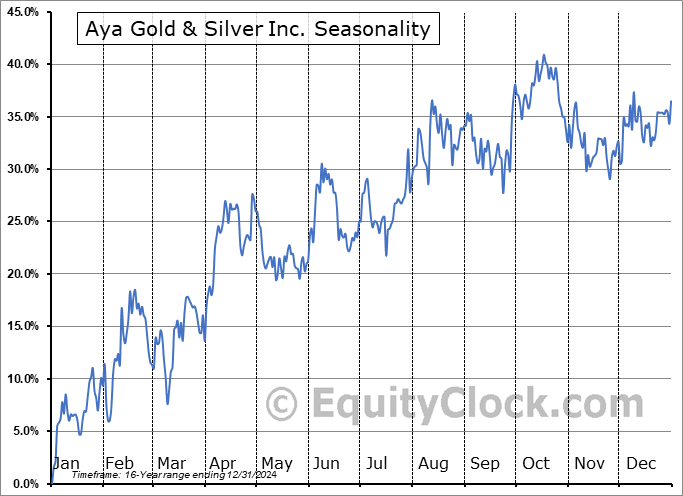
Aya Gold & Silver Inc. (TSE:AYA.TO) Seasonal Chart

iShares MSCI South Korea Capped ETF (NYSE:EWY) Seasonal Chart
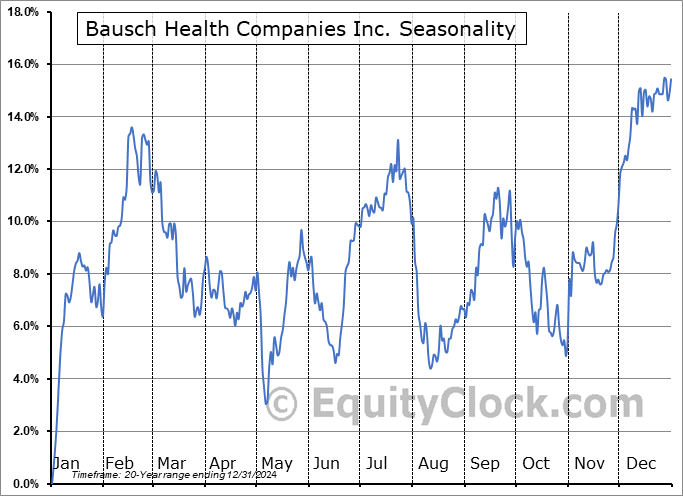
Bausch Health Companies Inc. (TSE:BHC.TO) Seasonal Chart

Algoma Central Corp. (TSE:ALC.TO) Seasonal Chart

Brainstorm Cell Therapeutics Inc. (NASD:BCLI) Seasonal Chart

Cirrus Logic, Inc. (NASD:CRUS) Seasonal Chart
The Markets
Stocks rallied on Monday as many of the factors that gripped markets previously (eg. the liquidity crunch, rotation from technology) alleviated and the positivity that is notorious for the US Thanksgiving holiday week takes hold. The S&P 500 Index jumped by 1.55%, moving into the range of Thursday’s upside gap that followed the positivity from earnings from NVDIA (NVDA) between 6663 and 6737. Two important zones of gap resistance remain overhead (~6760 and ~6830), the lower of which is up-to-bat heading further into this period of holiday positivity. Despite the strength, the ultra-short-term trend that the hourly chart portrays is still showing lower-highs and lower-lows. The bears will have to contend positive seasonality ahead with gains the norm for market benchmarks during the US Thanksgiving holiday week, leaving the bias to use the recent weakness to buy into risk rather than sell out of it. As we have been emphasizing, the 20-week moving average (~6550) has been the desired risk-reward point to adding new risk exposure to portfolios and the large-cap benchmark tested this point on Thursday. We continue to rely on our list of candidates in the market that are worthy to Accumulate or Avoid, which continues to show more ideas worthy to buy than to sell.


Want to know which areas of the market to buy or sell? Our Weekly Chart Books have just been updated, providing a clear Accumulate, Avoid, or Neutral rating for currencies, cryptocurrencies, commodities, broad markets, and subsectors/industries of the market. Subscribers can login and click on the relevant links to access.
- Currencies
- Cryptocurrencies
- Commodities
- Major Benchmarks
- Sub-sectors / Industries
- ETFs: Bonds | Commodities | Equity Markets | Industries | Sectors
Subscribe now.
Today, in our Market Outlook to subscribers, we discuss the following:
- Our weekly chart books update, along with our list of all segments of the market to either Accumulate or Avoid
- Other Notes
Subscribers can look for this report in their inbox or by clicking on the following link and logging in: Market Outlook for November 25
Not signed up yet? Subscribe now to receive full access to all of the research and analysis that we publish
Sentiment on Monday, as gauged by the put-call ratio, ended bullish at 0.88.

Seasonal charts of companies reporting earnings today:


S&P 500 Index


TSE Composite


| Sponsored By... |

|


