Stock Market Outlook for November 28, 2025

A bifurcated economy requires being “choiceful” in stock selection, but there is still plenty to buy at this seasonally strong time of year.
*** Stocks highlighted are for information purposes only and should not be considered as advice to purchase or to sell mentioned securities. As always, the use of technical and fundamental analysis is encouraged in order to fine tune entry and exit points to average seasonal trends.
Stocks Entering Period of Seasonal Strength Today:
Subscribers Click on the relevant link to view the full profile. Not a subscriber? Signup here.

Cardlytics, Inc. (NASD:CDLX) Seasonal Chart

Performance Food Group Co. (NYSE:PFGC) Seasonal Chart

Aberdeen Global Dynamic Dividend Fund (NYSE:AGD) Seasonal Chart

Major Drilling Group Intl, Inc. (TSE:MDI.TO) Seasonal Chart
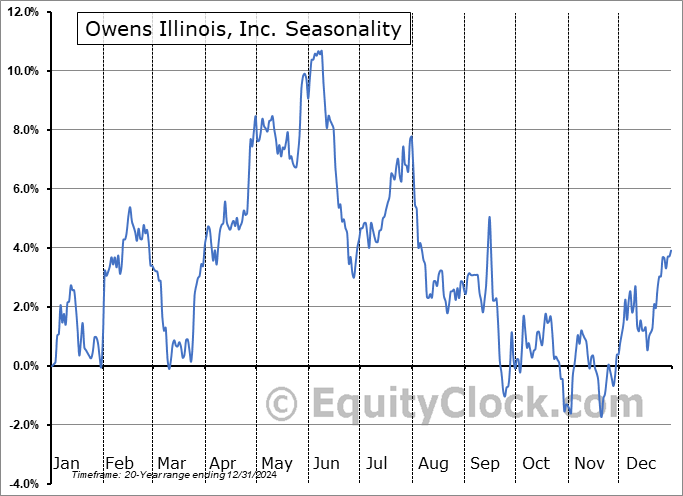
Owens Illinois, Inc. (NYSE:OI) Seasonal Chart

SPDR S&P Global Natural Resources ETF (NYSE:GNR) Seasonal Chart

VanEck Vectors Steel ETF (NYSE:SLX) Seasonal Chart

Federated Hermes, Inc. (NYSE:FHI) Seasonal Chart

VanEck Vectors Vietnam ETF (NYSE:VNM) Seasonal Chart

Consumer Portfolio Services, Inc. (NASD:CPSS) Seasonal Chart

Taiwan Fund, Inc. (NYSE:TWN) Seasonal Chart

Amplify Junior Silver Miners ETF (AMEX:SILJ) Seasonal Chart

B2Gold Corp. (TSE:BTO.TO) Seasonal Chart

CES Energy Solutions Corp. (TSE:CEU.TO) Seasonal Chart

Celanese Corp. (NYSE:CE) Seasonal Chart

Pan American Silver Corp. (NYSE:PAAS) Seasonal Chart

iShares S&P/TSX Global Base Metals Index ETF (TSE:XBM.TO) Seasonal Chart

iShares S&P/TSX Small Cap Index ETF (TSE:XCS.TO) Seasonal Chart

Global X Copper Miners ETF (NYSE:COPX) Seasonal Chart

SPDR S&P Emerging Markets Small Cap ETF (NYSE:EWX) Seasonal Chart
Note: With the US market closure on Thursday as a result of the Thanksgiving holiday, our next daily Market Outlook report will be released on Saturday morning, while our extensive Monthly Outlook for December is slated to be released on Friday. Happy Thanksgiving!
The Markets
The rally that has stemmed from the November 20th date that we have been targeting in our work has stretched into a fourth session as holiday positivity alleviates the strains and concerns that weighed on stocks previous. The S&P 500 Index advanced by 0.69%, breaking above horizontal resistance from the past two weeks at 6770; previous resistance now turns into support at this threshold. Gap resistance around 6830 is now up to bat. With Wednesday’s breakout, the market is starting to prove that it is no longer showing greater respect to levels of resistance than to levels of support, at least on an ultra-short-term timescale. The bears continue to contend with positive seasonality for this time of year with gains the norm for market benchmarks through the start of December, leaving the bias to use the recent weakness to buy into risk rather than sell out of it. As we have been emphasizing, the 20-week moving average (~6550) has been the desired risk-reward point to adding new risk exposure to portfolios and the large-cap benchmark tested this point last Thursday. So far, everything is playing out well according to our playbook and our list of candidates in the market that are worthy to Accumulate or Avoid continues to provide ideas on how to position in this market that has become fairly volatile in recent weeks.


Today, in our Market Outlook to subscribers, we discuss the following:
- US Durable Goods Orders and the investment implications within
- Caterpillar (CAT)
- Emerging Market stocks
- The highly abnormal decline in shipping volumes in 2025
- Transportation stocks
- Weekly Jobless Claims and the health of the labor market
Subscribers can look for this report in their inbox or by clicking on the following link and logging in: Market Outlook for November 28
Not signed up yet? Subscribe now to receive full access to all of the research and analysis that we publish
Sentiment on Wednesday, as gauged by the put-call ratio, ended bullish at 0.84.

Seasonal charts of companies reporting earnings today:
- No significant earnings scheduled for today.
S&P 500 Index


TSE Composite


| Sponsored By... |

|


