Stock Market Outlook for December 9, 2025

Risk-on leadership is strengthening, favouring core-cyclical exposure in portfolios.
*** Stocks highlighted are for information purposes only and should not be considered as advice to purchase or to sell mentioned securities. As always, the use of technical and fundamental analysis is encouraged in order to fine tune entry and exit points to average seasonal trends.
Stocks Entering Period of Seasonal Strength Today:
Subscribers Click on the relevant link to view the full profile. Not a subscriber? Signup here.

BMO Equal Weight Industrials Index ETF (TSE:ZIN.TO) Seasonal Chart

iShares Canadian Value Index ETF (TSE:XCV.TO) Seasonal Chart
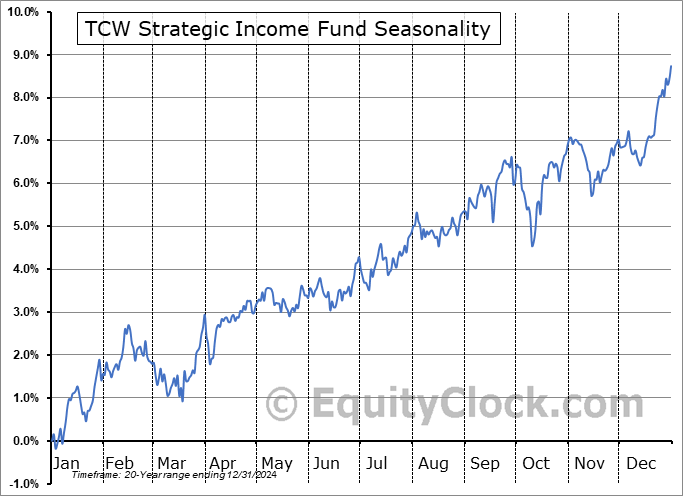
TCW Strategic Income Fund (NYSE:TSI) Seasonal Chart

Doubleview Gold Corp. (TSXV:DBG.V) Seasonal Chart

SPDR S&P Pharmaceuticals ETF (NYSE:XPH) Seasonal Chart

Vanguard Energy ETF (NYSE:VDE) Seasonal Chart

abrdn Physical Platinum Shares ETF (NYSE:PPLT) Seasonal Chart

ING Emerging Markets High Income (NYSE:IHD) Seasonal Chart

iShares North American Natural Resources ETF (NYSE:IGE) Seasonal Chart

iShares International Select Dividend ETF (NYSE:IDV) Seasonal Chart
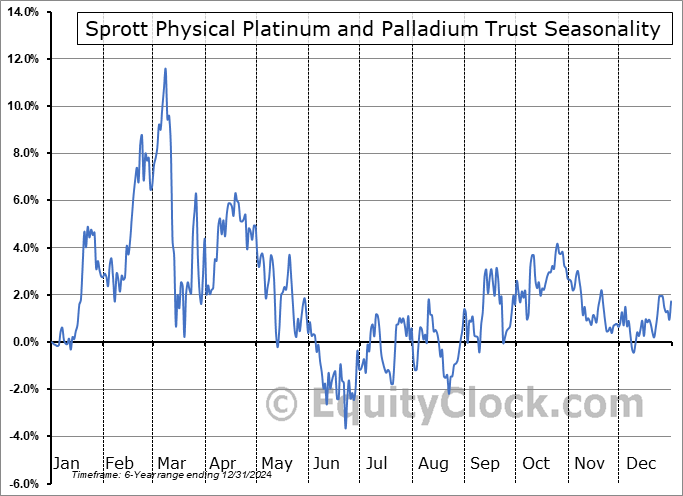
Sprott Physical Platinum and Palladium Trust (TSE:SPPP.TO) Seasonal Chart

MomentumShares U.S. Quantitative Momentum ETF (NASD:QMOM) Seasonal Chart

Erdene Resource Development Corp. (TSE:ERD.TO) Seasonal Chart

Ambev SA (NYSE:ABEV) Seasonal Chart

Huntington Ingalls Industries Inc. (NYSE:HII) Seasonal Chart

Endeavour Mining Corp. (TSE:EDV.TO) Seasonal Chart

iShares S&P/TSX Capped REIT Index ETF (TSE:XRE.TO) Seasonal Chart

CGI Group, Inc. (TSE:GIB/A.TO) Seasonal Chart

Ensign Energy Services, Inc. (TSE:ESI.TO) Seasonal Chart

CAE, Inc. (TSE:CAE.TO) Seasonal Chart

iShares S&P/TSX Canadian Dividend Aristocrats Index ETF (TSE:CDZ.TO) Seasonal Chart

GE Aerospace (NYSE:GE) Seasonal Chart

Jefferies Financial Group Inc. (NYSE:JEF) Seasonal Chart
Disclaimer: Comments and opinions offered in this report are for information only. They should not be considered as advice to purchase or to sell mentioned securities. Data offered is believed to be accurate, but is not guaranteed.
The Markets
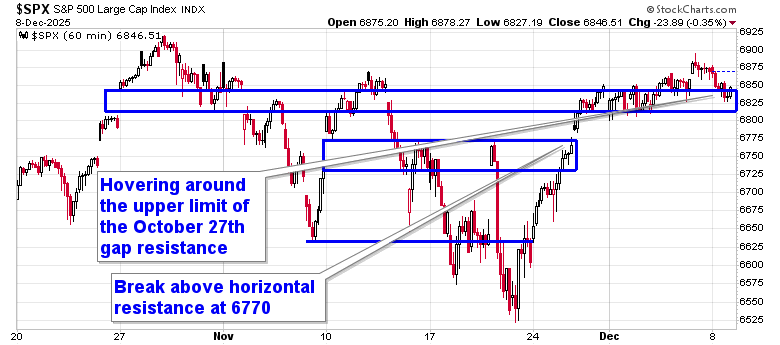
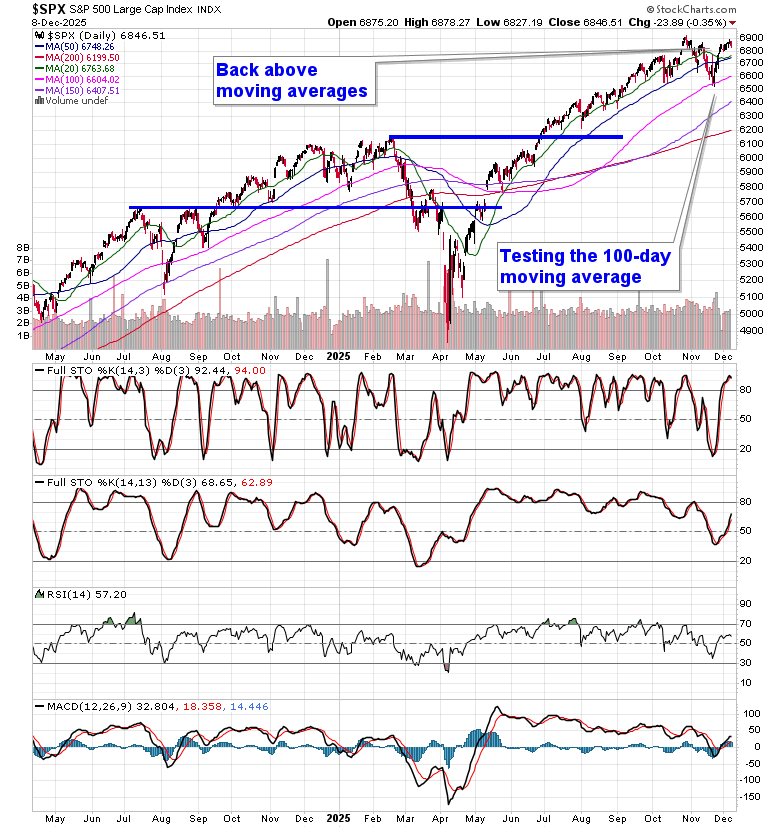
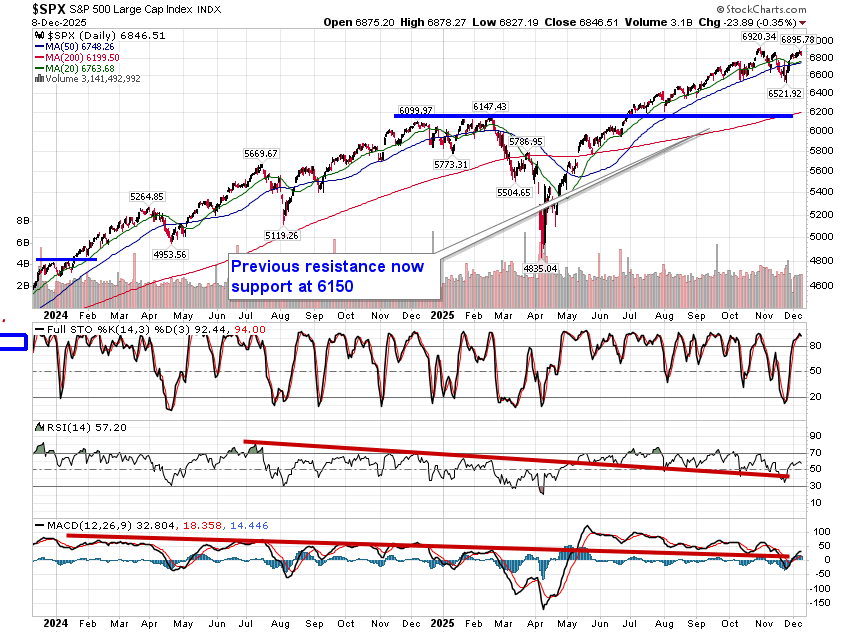
Stocks closed slightly lower on Monday as the normal digestion of end of November strength plays out and as investors look towards the outcome of the Fed meeting on Wednesday. The S&P 500 Index edged lower by a third of one percent, reaching back into the range of the gap that was originally opened on October 27th around 6830. Previous gap resistance at 6770 continues to be looked to as support. The market has been proving that it is no longer showing greater respect to levels of resistance than to levels of support, at least on an ultra-short-term timescale, but the hurdles overhead are major nuts to crack and require broader participation to definitively break. The major threshold on the upside to scrutinize is, quite obviously, the all-time high at 6920 that was charted at the end of October. The bears continue to contend with positive seasonality for this time of year with gains the norm for market benchmarks in December, but a softer period on the calendar through the first half of December following the strong end of November performance has been sufficient to fuel digestion of recent strength. As we have been emphasizing, the 20-week moving average (now around 6630) has been the desired risk-reward point to adding new risk exposure to portfolios and the large-cap benchmark tested this point two weeks ago. So far, everything is playing out well according to our playbook and we continue to embrace the new themes that are emerging to invest in (refer to our list of candidates in the market that are worthy to Accumulate or Avoid for ideas on how to position).
Want to know which areas of the market to buy or sell? Our Weekly Chart Books have just been updated, providing a clear Accumulate, Avoid, or Neutral rating for currencies, cryptocurrencies, commodities, broad markets, and subsectors/industries of the market. Subscribers can login and click on the relevant links to access.
- Currencies
- Cryptocurrencies
- Commodities
- Major Benchmarks
- Sub-sectors / Industries
- ETFs: Bonds | Commodities | Equity Markets | Industries | Sectors
Subscribe now.
Today, in our Market Outlook to subscribers, we discuss the following:
- Our weekly chart books update, along with the list of all segments in the market to either Accumulate or Avoid
- Other Notes
Subscribers can look for this report in their inbox or by clicking on the following link and logging in: Market Outlook for December 9
Not signed up yet? Subscribe now to receive full access to all of the research and analysis that we publish
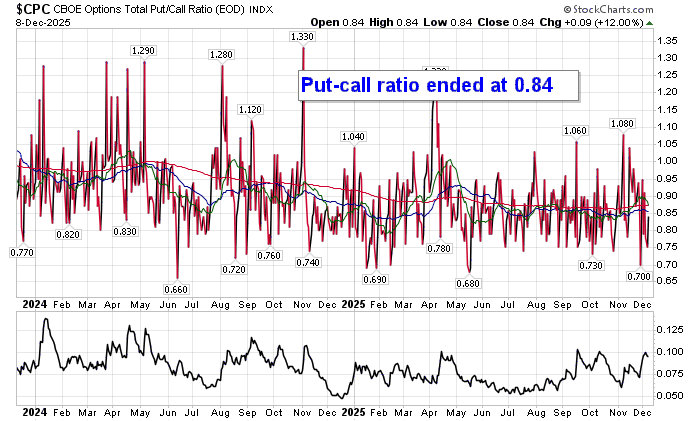
Sentiment on Monday, as gauged by the put-call ratio, ended bullish at 0.84.
Seasonal charts of companies reporting earnings today:


S&P 500 Index

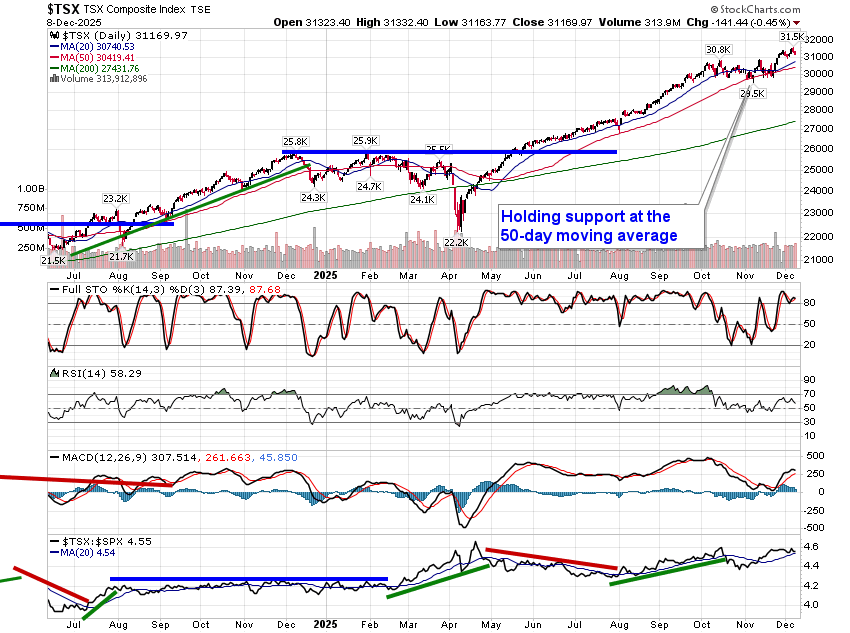
TSE Composite
| Sponsored By... |

|


