Stock Market Outlook for December 11, 2025

Opening up the 2026 playbook for stocks, commodities, bonds, and the dollar.
*** Stocks highlighted are for information purposes only and should not be considered as advice to purchase or to sell mentioned securities. As always, the use of technical and fundamental analysis is encouraged in order to fine tune entry and exit points to average seasonal trends.
Stocks Entering Period of Seasonal Strength Today:
Subscribers Click on the relevant link to view the full profile. Not a subscriber? Signup here.

Invesco International BuyBack Achievers TM ETF (NASD:IPKW) Seasonal Chart

VanEck Vectors Oil Services ETF (NYSE:OIH) Seasonal Chart

Tactile Systems Technology Inc. (NASD:TCMD) Seasonal Chart

Invesco S&P 500 Equal Weight Energy ETF (NYSE:RSPG) Seasonal Chart

iShares U.S. Oil Equipment & Services ETF (NYSE:IEZ) Seasonal Chart

Agnico-Eagle Mines Ltd. (TSE:AEM.TO) Seasonal Chart

Toronto-Dominion Bank (TSE:TD.TO) Seasonal Chart

iShares MSCI Emerging Markets ETF (NYSE:EEM) Seasonal Chart

Surge Energy Inc. (TSE:SGY.TO) Seasonal Chart

Imperial Metals Corp. (TSE:III.TO) Seasonal Chart

Platinum Group Metals Ltd. (AMEX:PLG) Seasonal Chart

Element Solutions Inc. (NYSE:ESI) Seasonal Chart
Disclaimer: Comments and opinions offered in this report are for information only. They should not be considered as advice to purchase or to sell mentioned securities. Data offered is believed to be accurate, but is not guaranteed.
The Markets
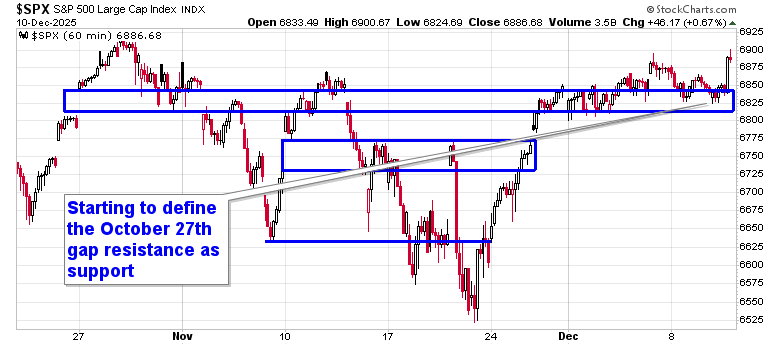
Stocks posted gains on Wednesday as the Federal Reserve cut rates for a third time this year and indicated the start of a Treasury purchase program beginning this Friday. The S&P 500 Index jumped by two-thirds of one percent, moving past the range of the gap that was originally opened on October 27th around 6830. This previous level of short-term resistance now turns to support, adding to the prior zone of gap support at 6770. The market continues to prove that it is no longer showing greater respect to levels of resistance than to levels of support, at least on an ultra-short-term timescale and the time has come to attack the significant hurdles overhead, particularly as we get into the Santa Claus Rally period that starts next week (according to our own definition of the holiday driven influence). The major threshold on the upside to scrutinize is, quite obviously, the all-time high at 6920 that was charted at the end of October. The bears continue to contend with positive seasonality for this time of year with gains the norm for market benchmarks in December, but a softer period on the calendar through the first half of December has been playing out following the strong end of November performance. So far, everything is playing out well according to our playbook and we continue to embrace the new themes that are emerging to invest in (refer to our list of candidates in the market that are worthy to Accumulate or Avoid for ideas on how to position).
Today, in our Market Outlook to subscribers, we discuss the following:
- Reaction in yields and the US Dollar following the Fed event
- Average tendency of stocks during Mid-Term Election years
- Average tendency of economic performance during Mid-Term Election years
- The potential return of equity market volatility in 2026
- The impact of Mid-Term Election years on bond yields and how to position around the various phases of the year
- Dollar and Commodity exposure in 2026
Subscribers can look for this report in their inbox or by clicking on the following link and logging in: Market Outlook for December 11
Not signed up yet? Subscribe now to receive full access to all of the research and analysis that we publish
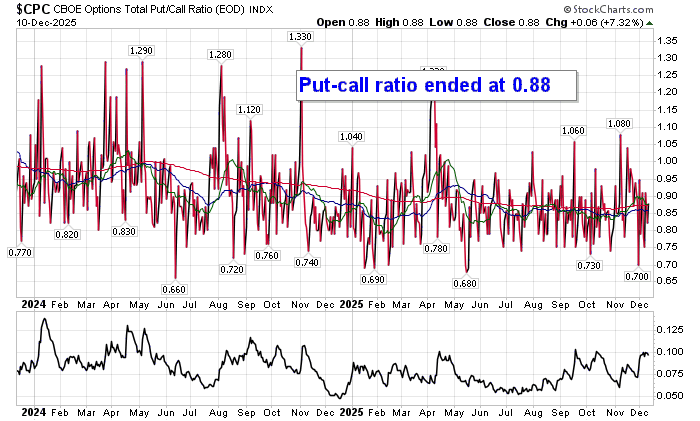
Sentiment on Wednesday, as gauged by the put-call ratio, ended bullish at 0.88.
Seasonal charts of companies reporting earnings today:


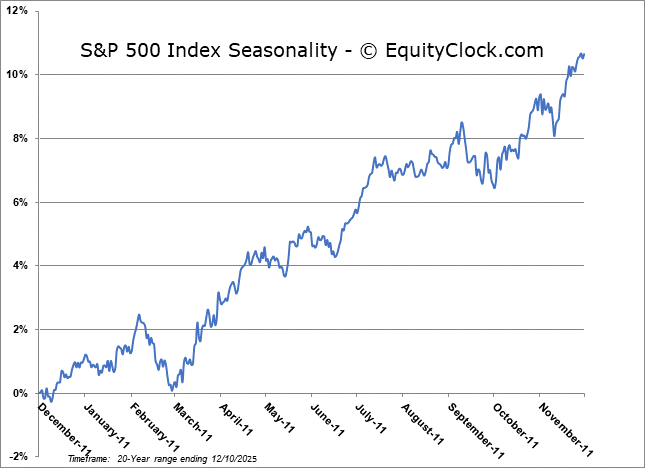
S&P 500 Index
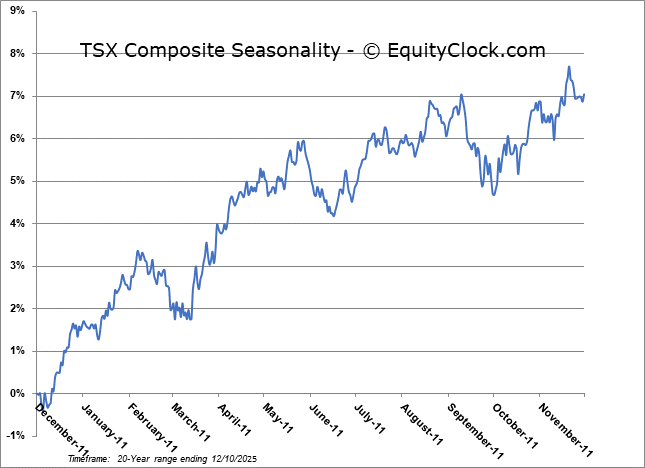
TSE Composite
| Sponsored By... |

|


