Stock Market Outlook for December 15, 2025

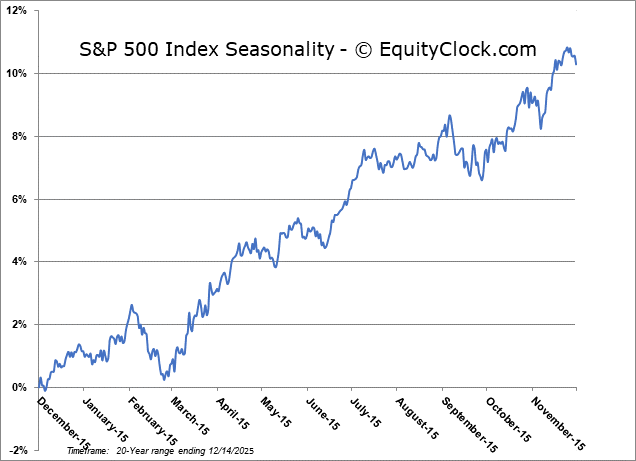
The S&P 500 Index realized the mild decline that is normal of the tax loss selling period. We’ll tell you which areas of the market to focus on for the Santa Claus Rally period rebound.
*** Stocks highlighted are for information purposes only and should not be considered as advice to purchase or to sell mentioned securities. As always, the use of technical and fundamental analysis is encouraged in order to fine tune entry and exit points to average seasonal trends.
Stocks Entering Period of Seasonal Strength Today:
Subscribers Click on the relevant link to view the full profile. Not a subscriber? Signup here.
Disclaimer: Comments and opinions offered in this report are for information only. They should not be considered as advice to purchase or to sell mentioned securities. Data offered is believed to be accurate, but is not guaranteed.

iShares U.S. Basic Materials ETF (NYSE:IYM) Seasonal Chart

Invesco S&P MidCap Momentum ETF (AMEX:XMMO) Seasonal Chart

Invesco DWA Emerging Markets Momentum ETF (NASD:PIE) Seasonal Chart

iShares U.S. Oil & Gas Exploration & Production ETF (NYSE:IEO) Seasonal Chart

Darden Restaurants, Inc. (NYSE:DRI) Seasonal Chart

Oceaneering Intl, Inc. (NYSE:OII) Seasonal Chart

Ur-Energy, Inc. (TSE:URE.TO) Seasonal Chart

Cooper Cos. Inc. (NASD:COO) Seasonal Chart

Royal Bank of Canada (TSE:RY.TO) Seasonal Chart

Lockheed Martin Corp. (NYSE:LMT) Seasonal Chart

Eastman Chemical Co. (NYSE:EMN) Seasonal Chart

North American Construction Group Ltd. (NYSE:NOA) Seasonal Chart

Invesco S&P SmallCap Energy ETF (NASD:PSCE) Seasonal Chart

iShares S&P/TSX 60 Index ETF (TSE:XIU.TO) Seasonal Chart
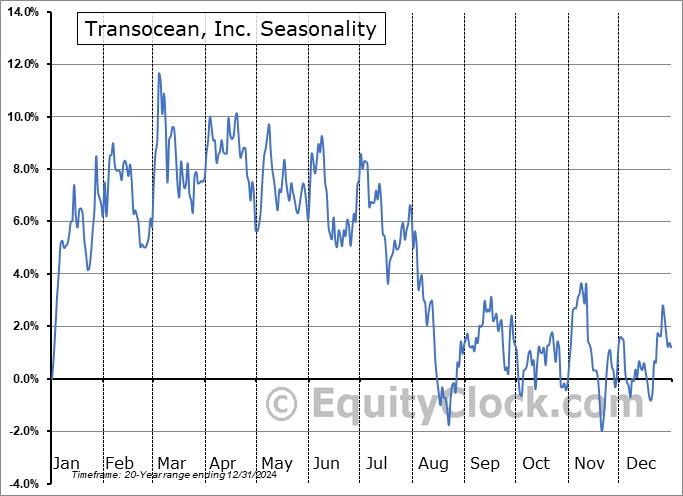
Transocean, Inc. (NYSE:RIG) Seasonal Chart

LyondellBasell Industries NV (NYSE:LYB) Seasonal Chart

Tidewater, Inc. (NYSE:TDW) Seasonal Chart

Diamondback Energy, Inc. (NASD:FANG) Seasonal Chart
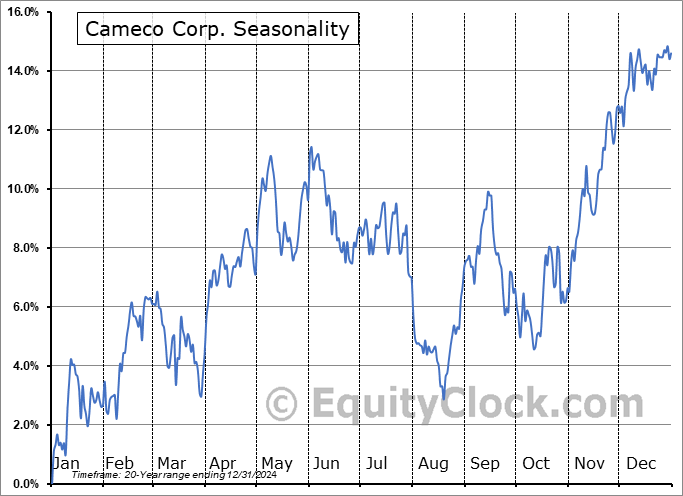
Cameco Corp. (TSE:CCO.TO) Seasonal Chart

First Quantum Minerals Ltd. (TSE:FM.TO) Seasonal Chart

BHP Group Limited (NYSE:BHP) Seasonal Chart

McEwen Mining Inc. (TSE:MUX.TO) Seasonal Chart

Canadian Pacific Railway (TSE:CP.TO) Seasonal Chart

BMO S&P/TSX Equal Weight Global Gold Index ETF (TSE:ZGD.TO) Seasonal Chart

VanEck Vectors Gold Miners ETF (NYSE:GDX) Seasonal Chart
Note to subscribers using Yahoo or AOL emails: We continue to experience issues with the dissemination of our reports to subscribers using these email services. Unfortunately, Yahoo has been slow to react and we are still waiting for a response. Our deliverability team remains on the case to rectify what is essentially an inferior spam filtering system at Yahoo that is affecting a small (but important) subset of our audience. Emails to the majority of our subscribers are unaffected. We apologize for any inconvenience that may be resulting. In the meantime, subscribers affected can access these recent reports via the report archive located on the home page of the Chart Database. Thank you to those that are affected for your patience.
Disclaimer: Comments and opinions offered in this report are for information only. They should not be considered as advice to purchase or to sell mentioned securities. Data offered is believed to be accurate, but is not guaranteed.
The Markets
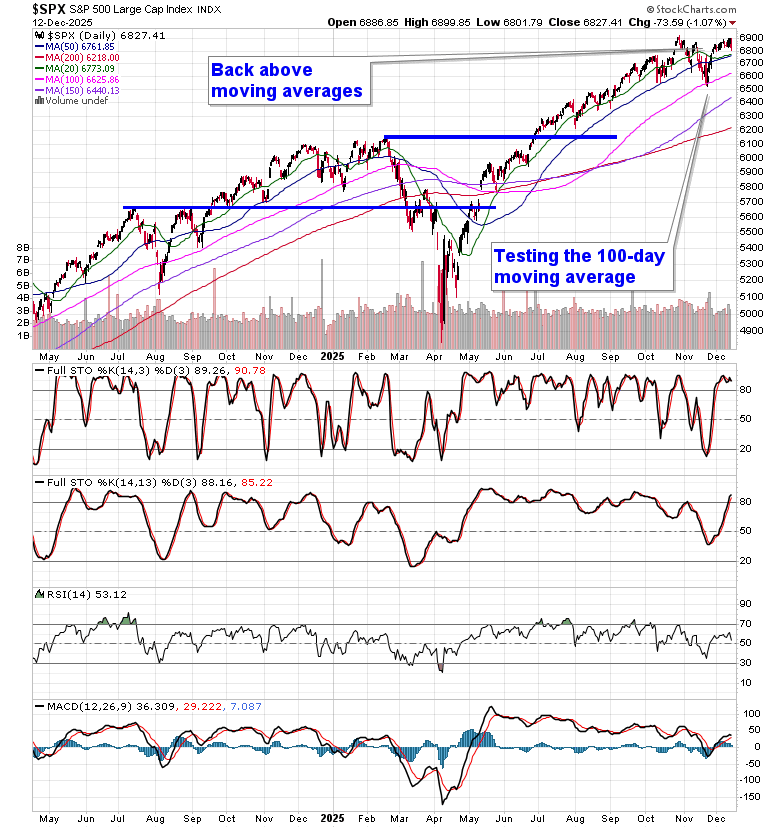
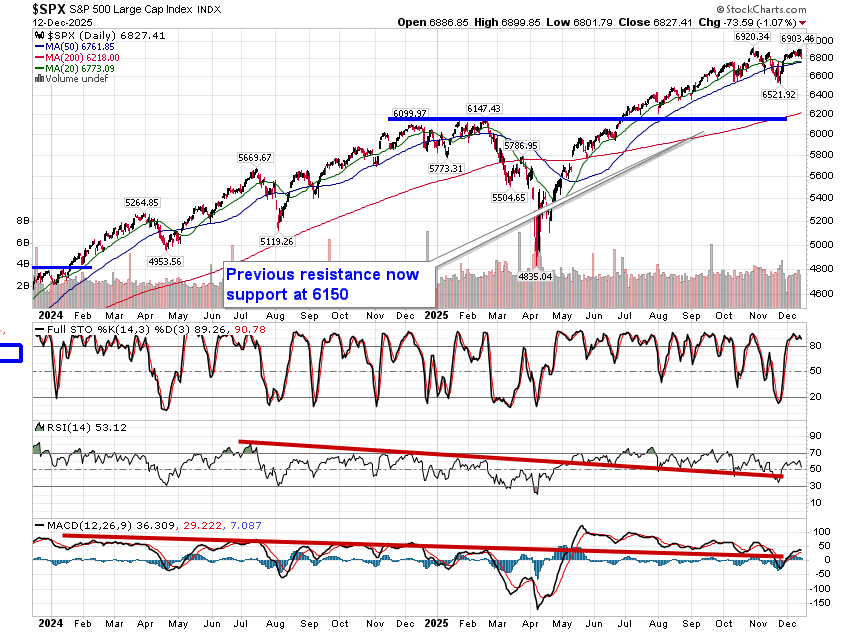
Stocks succumbed to selling pressures on Friday as the flight from Technology stocks continued. The S&P 500 Index shed 1.07%, moving back into the range of the gap that was originally opened on October 27th around 6830. This span of current support adds to the prior zone of gap support at 6770, a threshold that is still open to being tested before the notorious year-end seasonal positivity takes hold. Despite the slide recorded into the aforementioned span on Friday, the market continues to prove that it is no longer showing greater respect to levels of resistance than to levels of support, at least on an ultra-short-term timescale, and the likelihood is good that we will see the significant hurdles overhead attacked once into the Santa Claus Rally period that starts next week (according to our own definition of the holiday driven influence). The major threshold on the upside to scrutinize is, quite obviously, the all-time high at 6920 that was charted at the end of October. The bears continue to contend with positive seasonality for this time of year with gains the norm for market benchmarks in December, but a softer period on the calendar through the first half of December has been playing out following the strong end of November performance. Perhaps with some uncertainty arising surrounding technology, so far everything is playing out well according to our playbook and we continue to embrace the new themes that are emerging to invest in (refer to our list of candidates in the market that are worthy to Accumulate or Avoid for ideas on how to position).

Today, in our Market Outlook to subscribers, we discuss the following:
- Weekly look at the large-cap benchmark
- The conclusion of the average tax-loss selling period and the segments that are down the most through this timeframe
- The Santa Claus Rally period in stocks
- Bitcoin
Subscribers can look for this report in their inbox or by clicking on the following link and logging in: Market Outlook for December 15
Not signed up yet? Subscribe now to receive full access to all of the research and analysis that we publish
Sentiment on Friday, as gauged by the put-call ratio, ended bullish at 0.90.

Seasonal charts of companies reporting earnings today:


S&P 500 Index
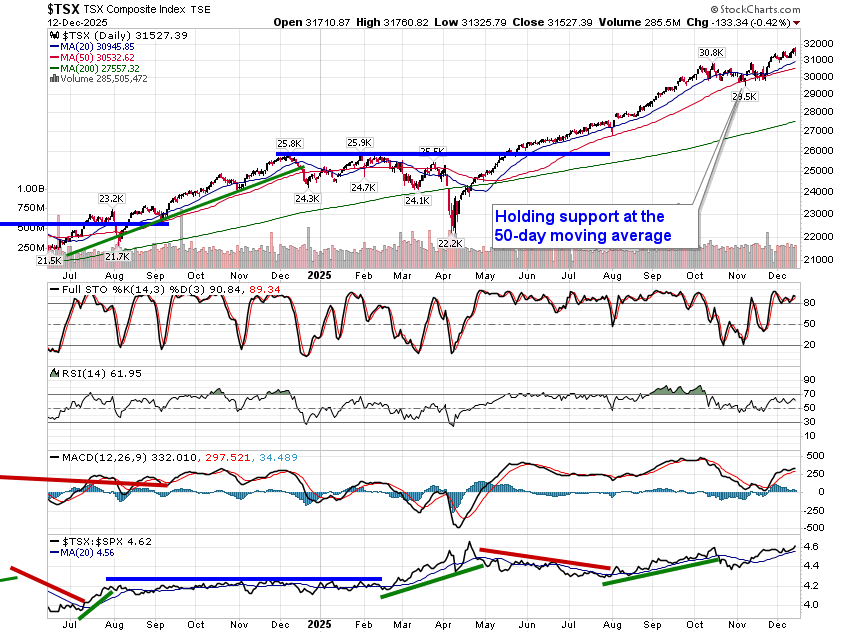
TSE Composite

| Sponsored By... |

|


