Stock Market Outlook for December 18, 2025

Clear signs of loss of Tech/AI leadership and other concerns for risk assets for early 2026.
*** Stocks highlighted are for information purposes only and should not be considered as advice to purchase or to sell mentioned securities. As always, the use of technical and fundamental analysis is encouraged in order to fine tune entry and exit points to average seasonal trends.
Stocks Entering Period of Seasonal Strength Today:
Subscribers Click on the relevant link to view the full profile. Not a subscriber? Signup here.

SPDR S&P Oil & Gas Equipment & Services ETF (NYSE:XES) Seasonal Chart

Invesco Senior Income Trust (NYSE:VVR) Seasonal Chart

SPDR Dow Jones International Real Estate ETF (NYSE:RWX) Seasonal Chart

Invesco DWA Energy Momentum ETF (NASD:PXI) Seasonal Chart

SPDR S&P Oil & Gas Exploration & Production ETF (NYSE:XOP) Seasonal Chart

iShares Global Industrials ETF (NYSE:EXI) Seasonal Chart

iShares MSCI Canada ETF (NYSE:EWC) Seasonal Chart

Flowserve Corp. (NYSE:FLS) Seasonal Chart

North American Construction Group Ltd (TSE:NOA.TO) Seasonal Chart

Southern Copper Corp. (NYSE:SCCO) Seasonal Chart

Taseko Mines Ltd. (TSE:TKO.TO) Seasonal Chart

Schlumberger Ltd. (NYSE:SLB) Seasonal Chart

United States Gasoline Fund, LP (NYSE:UGA) Seasonal Chart

Cardinal Energy Ltd. (TSE:CJ.TO) Seasonal Chart

Suncor Energy, Inc. (NYSE:SU) Seasonal Chart

McEwen Mining Inc. (NYSE:MUX) Seasonal Chart

Nutrien Ltd. (TSE:NTR.TO) Seasonal Chart
Disclaimer: Comments and opinions offered in this report are for information only. They should not be considered as advice to purchase or to sell mentioned securities. Data offered is believed to be accurate, but is not guaranteed.
The Markets
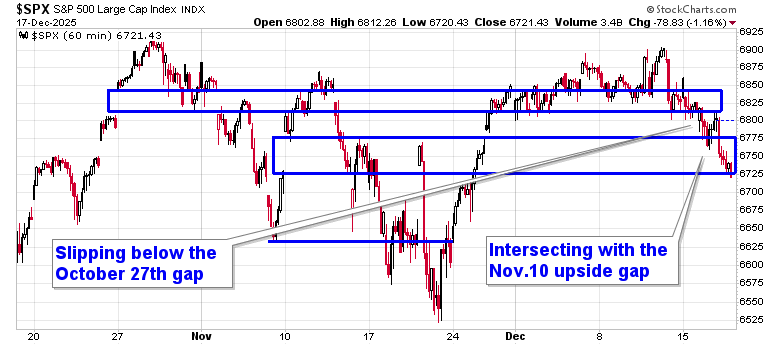
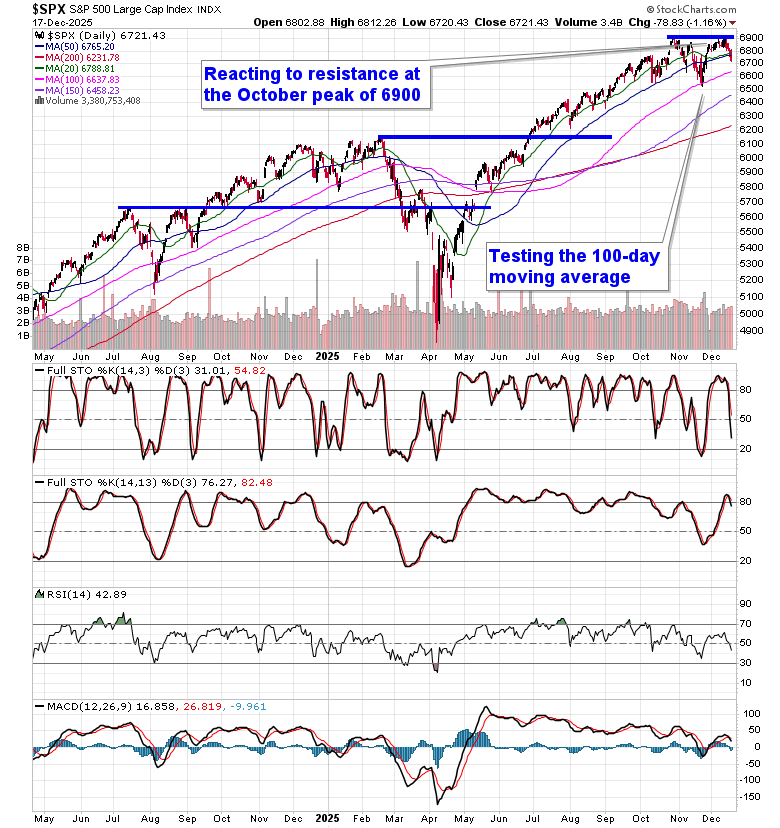
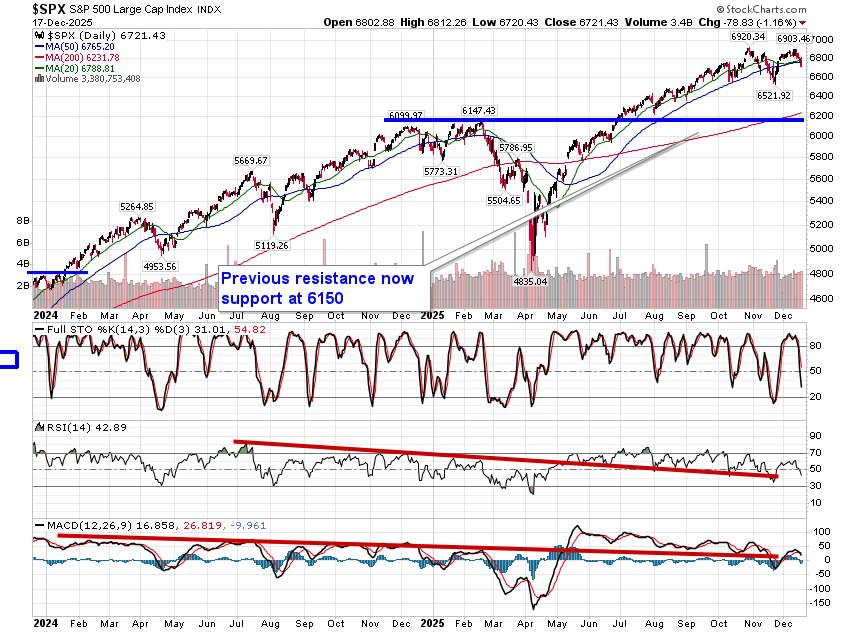
Renewed scrutiny over technology valuations and the strength of the Artificial Intelligence buildout sent stocks lower on Wednesday. The S&P 500 Index closed down by 1.16%, placing the November 10th upside gap between 6729 and 6785 to the test as support. This was viewed as a possibility before the notorious year-end seasonal positivity takes hold and scrutiny will be high to assure that no damage below this threshold materializes given the appearance of a broader topping pattern that becomes threatening by the day. Double-top resistance can be pegged around the 6900 level, a negative setup that would be completed by a move towards the November 20th lows around 6530; theoretical downside target of a move below the November bottom would be toward the February of 2025 high around 6150. As we have been stating, it is unlikely that the broader bearish pattern will materialize anything of substance until after the the positive seasonality for stocks at year-end and the weakness that has spilled into the market in recent days may prove to be ideal to deploy any remaining cash for the year-end positivity directly ahead. In the Seasonal Advantage Portfolio that we oversee at Castlemoore, we held a small cash balance from the profits that were booked in the seasonal trade in Natural Gas last week and we expect to deploy these funds into the equity market before this week is over. Themes in our chart books to either Accumulate or Avoid continue to look setup well for allocation into the end of 2025 and early 2026, but we are scrutinizing the technicals closely to determine if any changes are warranted before the year is complete.
Today, in our Market Outlook to subscribers, we discuss the following:
- Market & Technical Takeaways
- Technology & AI Leadership Breakdown
- Recession Signal: Treasury Yield Curve
- Credit Market Concerns
- Liquidity & Fed Balance Sheet
- Consumer: Still Resilient (For Now)
Subscribers can look for this report in their inbox or by clicking on the following link and logging in: Market Outlook for December 18
Not signed up yet? Subscribe now to receive full access to all of the research and analysis that we publish
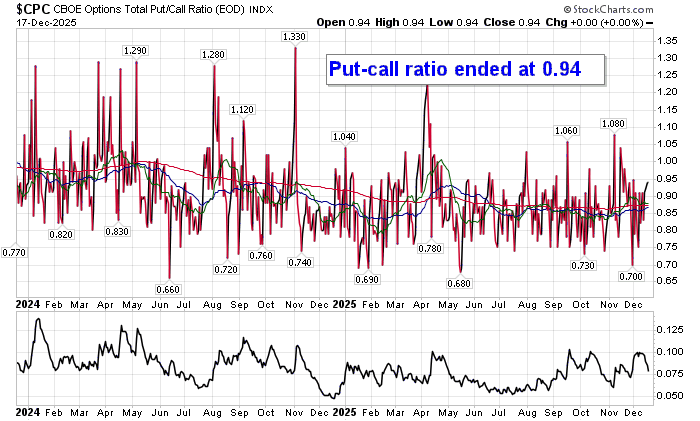
Sentiment on Wednesday, as gauged by the put-call ratio, ended close to neutral at 0.94.
Seasonal charts of companies reporting earnings today:


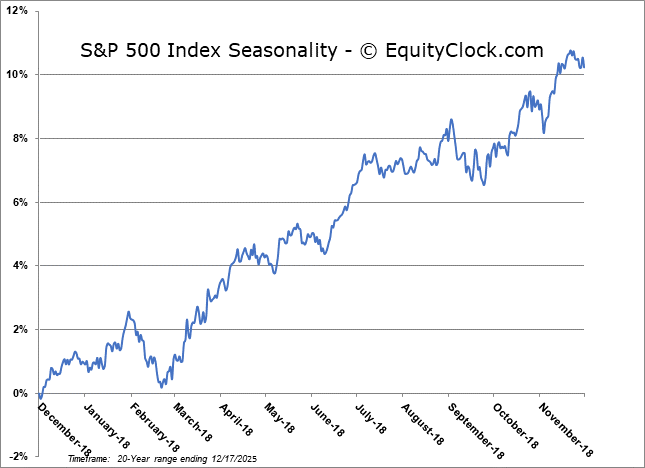
S&P 500 Index
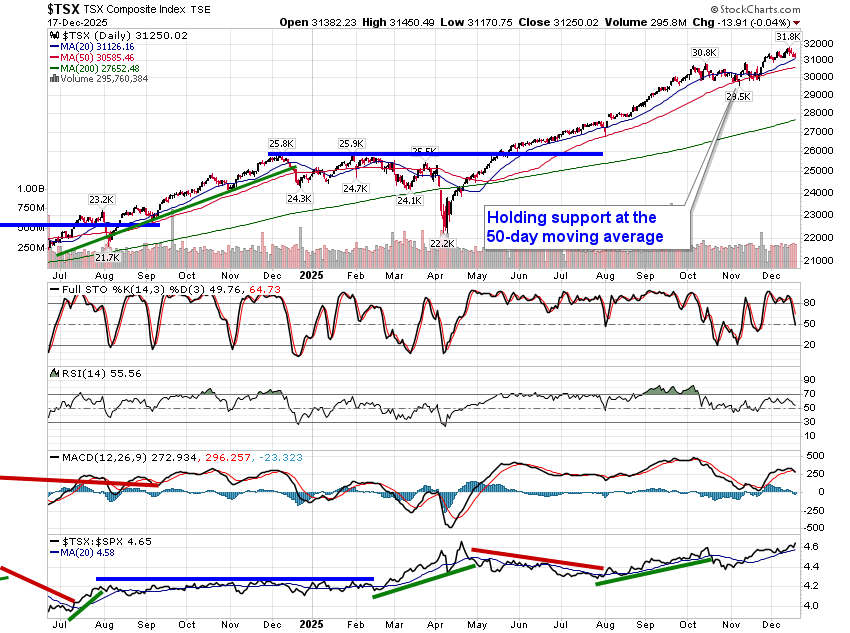
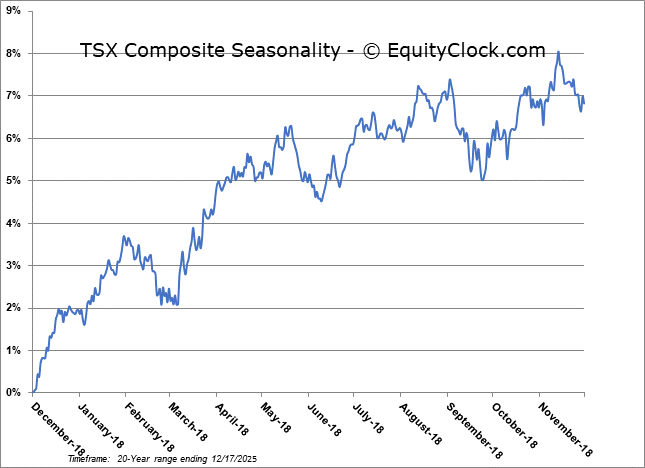
TSE Composite
| Sponsored By... |

|


