Stock Market Outlook for December 22, 2025

Santa Claus is starting to deliver on the positivity that is normal for stocks into the end of the year.
*** Stocks highlighted are for information purposes only and should not be considered as advice to purchase or to sell mentioned securities. As always, the use of technical and fundamental analysis is encouraged in order to fine tune entry and exit points to average seasonal trends.
Stocks Entering Period of Seasonal Strength Today:
Subscribers Click on the relevant link to view the full profile. Not a subscriber? Signup here.

Invesco China Technology ETF (NYSE:CQQQ) Seasonal Chart

Village Farms International, Inc. (NASD:VFF) Seasonal Chart

AmeriServ Financial, Inc. (NASD:ASRV) Seasonal Chart

iShares MSCI China Small-Cap ETF (NYSE:ECNS) Seasonal Chart

Headwater Exploration Inc. (TSE:HWX.TO) Seasonal Chart

Cronos Group Inc. (NASD:CRON) Seasonal Chart

Ballard Power Systems, Inc. (NASD:BLDP) Seasonal Chart
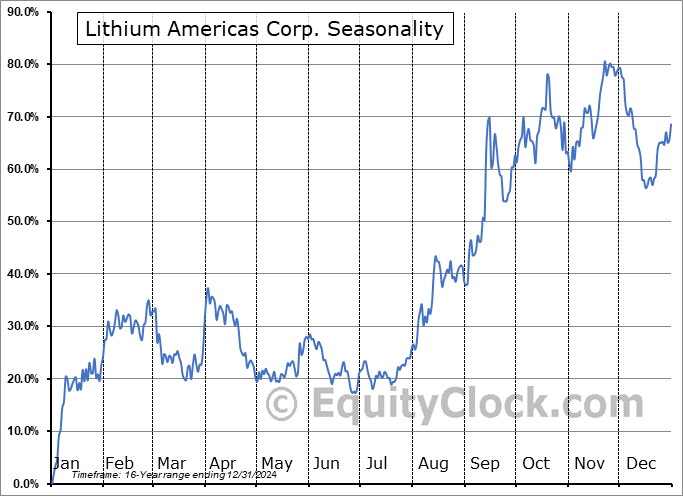
Lithium Americas Corp. (NYSE:LAC) Seasonal Chart
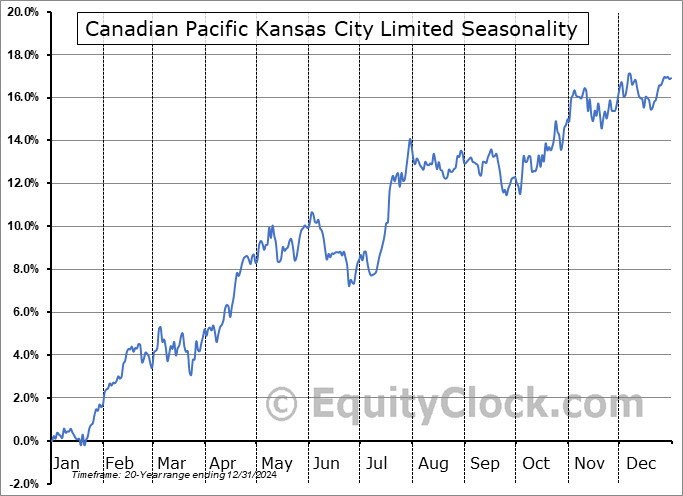
Canadian Pacific Kansas City Limited (NYSE:CP) Seasonal Chart
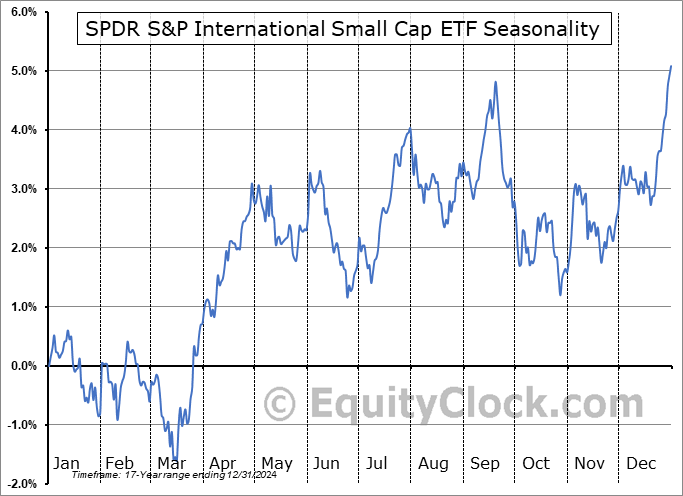
SPDR S&P International Small Cap ETF (NYSE:GWX) Seasonal Chart

Amplify Alternative Harvest ETF (NYSE:MJ) Seasonal Chart

EchoStar Holding Corp. (NASD:SATS) Seasonal Chart

Dream Office Real Estate Investment Trust (TSE:D/UN.TO) Seasonal Chart

International Business Machines (NYSE:IBM) Seasonal Chart

Enterprise Oilfield Group, Inc. (TSE:E.TO) Seasonal Chart
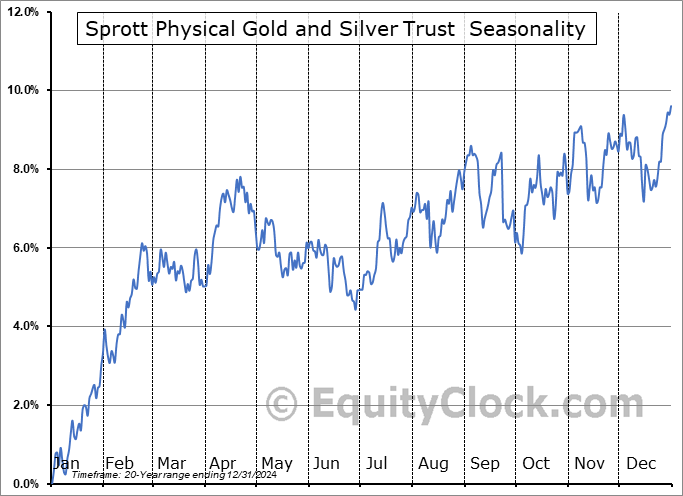
Sprott Physical Gold and Silver Trust (AMEX:CEF) Seasonal Chart

Silvercorp Metals Inc. (TSE:SVM.TO) Seasonal Chart

Franco-Nevada Corp. (NYSE:FNV) Seasonal Chart

Endeavour Silver Corp. (TSE:EDR.TO) Seasonal Chart

Brookfield Infrastructure Partners L.P. (NYSE:BIP) Seasonal Chart

Canadian Natural Resources Ltd. (NYSE:CNQ) Seasonal Chart
Disclaimer: Comments and opinions offered in this report are for information only. They should not be considered as advice to purchase or to sell mentioned securities. Data offered is believed to be accurate, but is not guaranteed.
The Markets
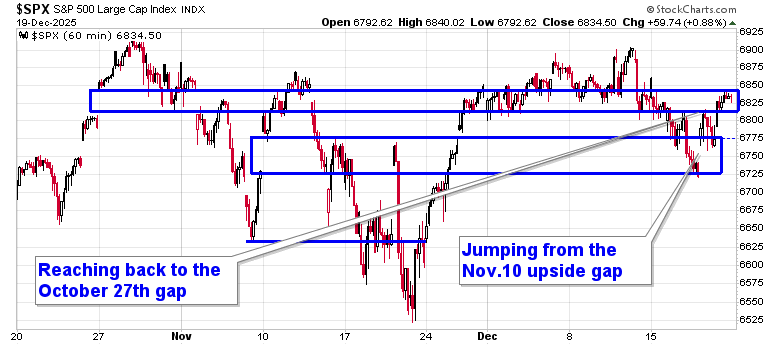
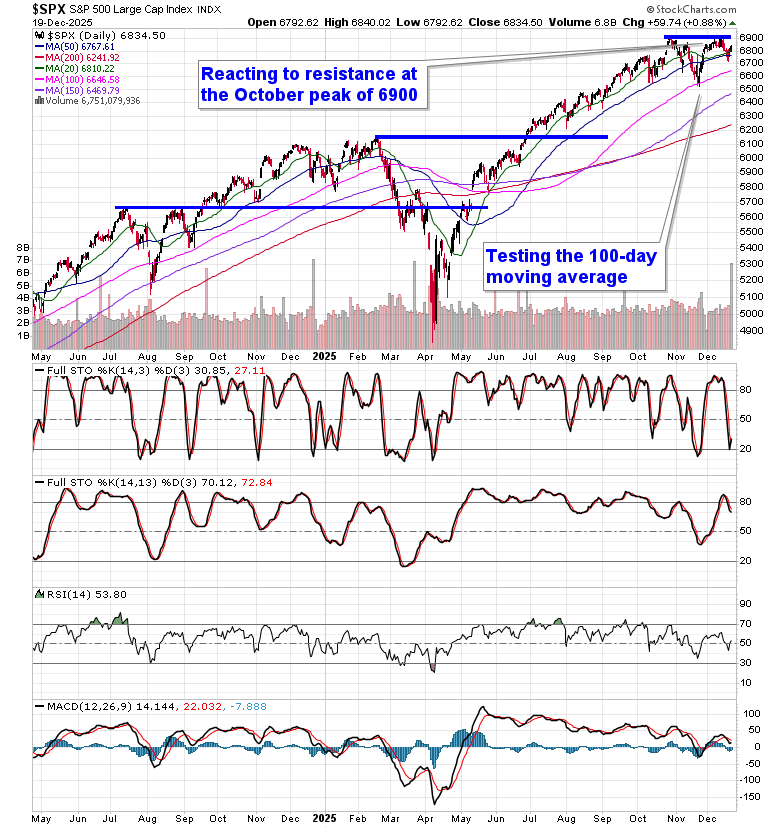
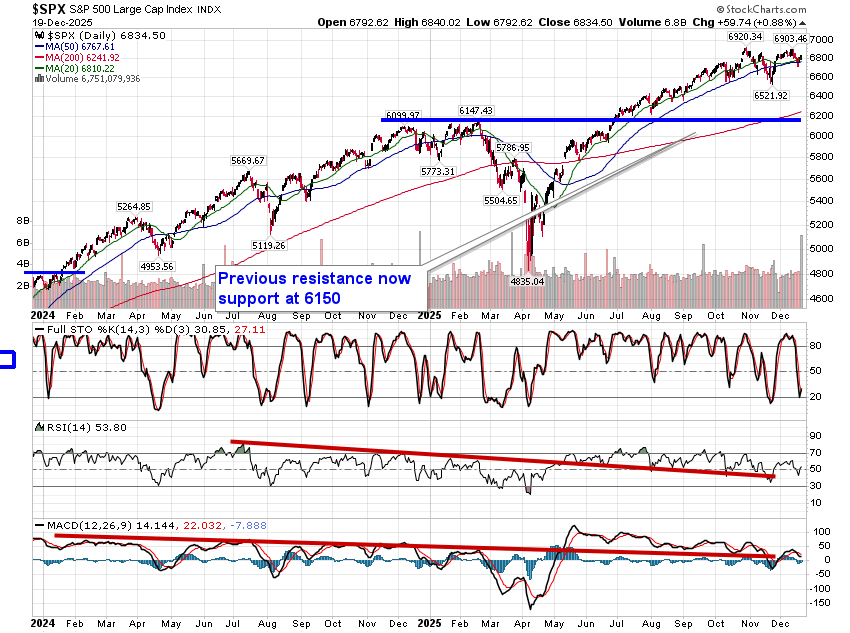
Stocks rallied on Friday, led by Technology, as shares of Oracle (ORCL) – the poster child for the scrutiny surrounding the AI trade – achieved an important bounce from a point of significant horizontal support at $180. The S&P 500 Index gained nearly nine-tenths of one percent, continuing to move higher from the zone of support presented by the November 10th upside gap between 6729 and 6785. This remains an important zone for the market to hold in order to allow the end of year seasonal positivity to proceed as expected. The October 27th gap is being contended with again and it remains the last barrier before an attack on the all-time highs can be achieved. Double-top resistance around the 6900 level is an obvious threat, a negative setup that would be completed by a move towards the November 20th lows around 6530; theoretical downside target of a move below the November bottom would be toward the February of 2025 high around 6150. As we have been stating, it is unlikely that the broader bearish pattern will materialize anything of substance until after the the positive seasonality for stocks at year-end and the weakness that spilled into the market earlier in the week has proven to be ideal to deploy any remaining cash for the year-end positivity that is upon us. In the Seasonal Advantage Portfolio that we oversee at Castlemoore, we held a small cash balance from the profits that were booked in the seasonal trade in Natural Gas last week and we deployed those funds into the equity market on Thursday. Themes in our chart books to either Accumulate or Avoid continue to look setup well for allocation into the end of 2025 and early 2026, but we are scrutinizing the technicals closely to determine if any changes are warranted before the year is complete.
Today, in our Market Outlook to subscribers, we discuss the following:
- Market & Technical Takeaways
- Seasonality & Weekly Trend
- Sector Leadership & Rotation
- Energy & Commodity Strategy
- Housing Market Warning Signs
- Homebuilders & Consumer Implications
- Consumer Momentum Deterioration
Subscribers can look for this report in their inbox or by clicking on the following link and logging in: Market Outlook for December 22
Not signed up yet? Subscribe now to receive full access to all of the research and analysis that we publish
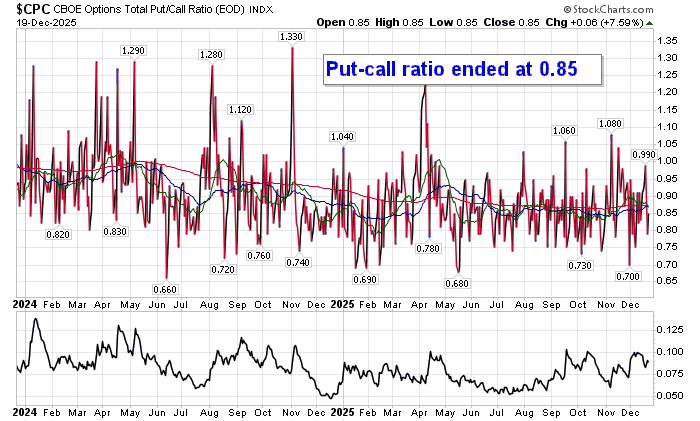
Sentiment on Friday, as gauged by the put-call ratio, ended bullish at 0.85.
Seasonal charts of companies reporting earnings today:
- No significant earnings scheduled for today.
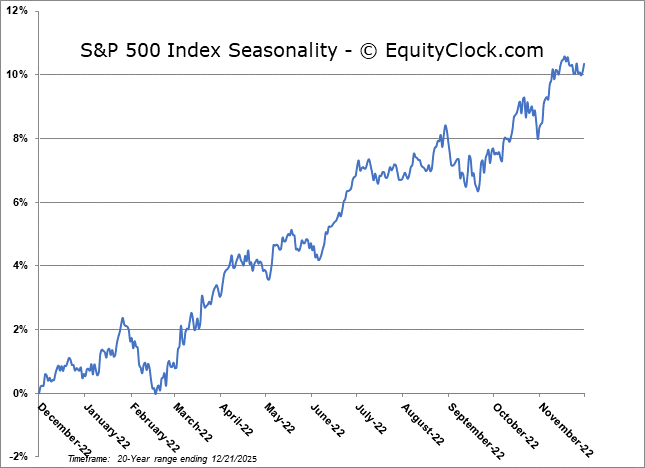
S&P 500 Index
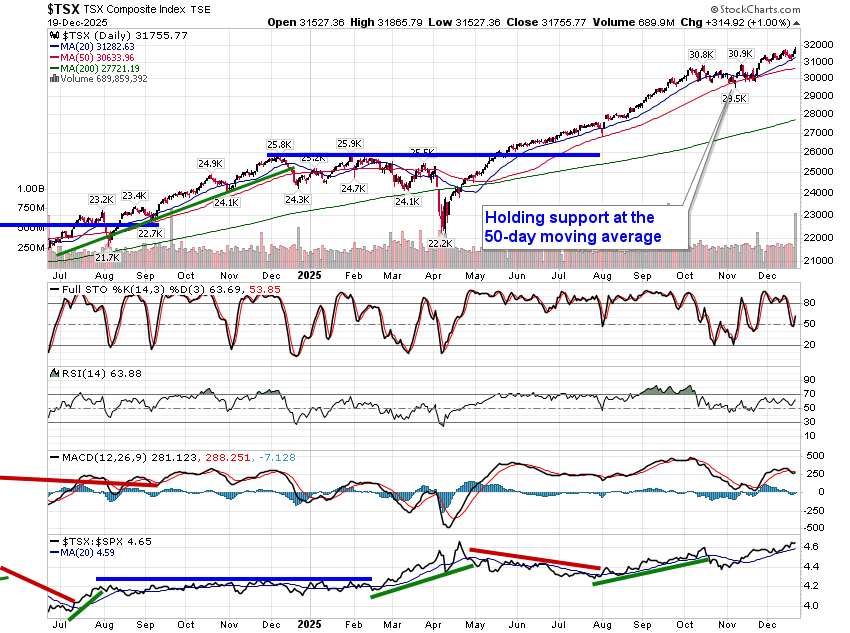
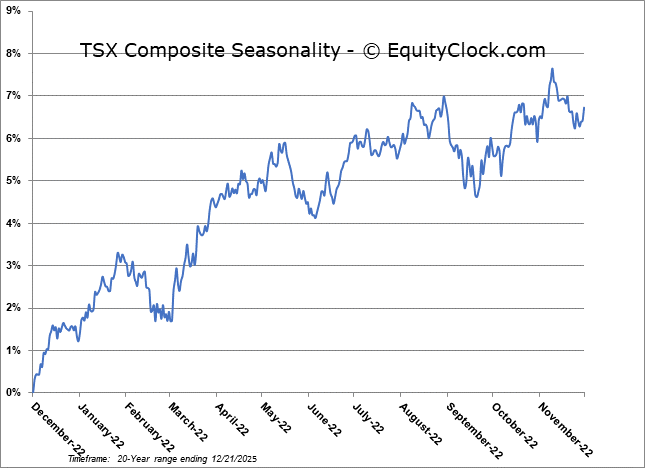
TSE Composite
| Sponsored By... |

|


