Stock Market Outlook for January 5, 2026

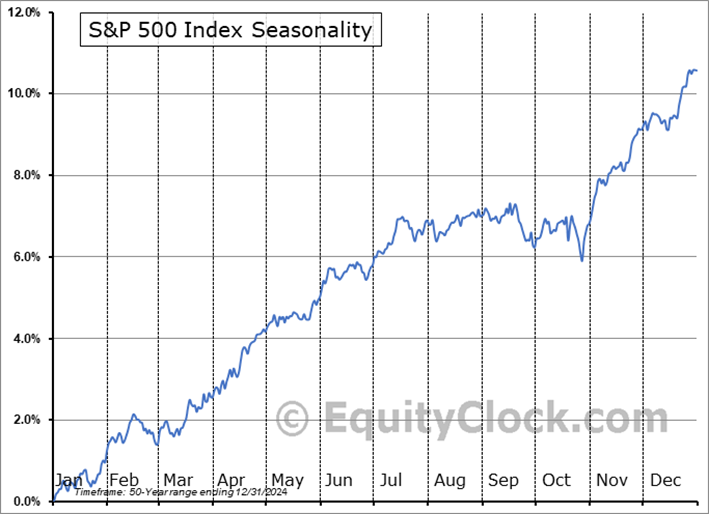
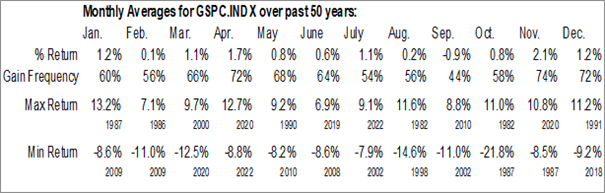
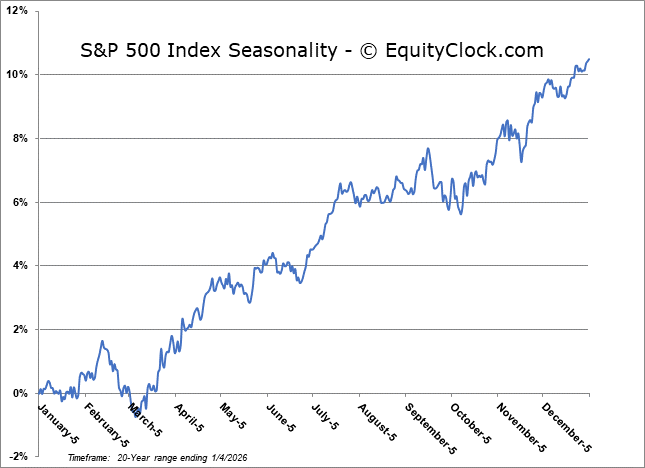
The first month of the year has historically generated strong results for stocks with the S&P 500 Index higher by 1.2%, on average, and gains realized in 60% of periods.
*** Stocks highlighted are for information purposes only and should not be considered as advice to purchase or to sell mentioned securities. As always, the use of technical and fundamental analysis is encouraged in order to fine tune entry and exit points to average seasonal trends.
Stocks Entering Period of Seasonal Strength Today:
Subscribers Click on the relevant link to view the full profile. Not a subscriber? Signup here.

Spectrum Brands Inc. (NYSE:SPB) Seasonal Chart

Puma Biotechnology, Inc. (NASD:PBYI) Seasonal Chart

Ellington Residential Mortgage REIT (NYSE:EARN) Seasonal Chart

iShares Core International Aggregate Bond ETF (AMEX:IAGG) Seasonal Chart

Teck Resources Ltd. (TSE:TECK/B.TO) Seasonal Chart

iShares Diversified Monthly Income ETF (TSE:XTR.TO) Seasonal Chart

Universal Health Services – Class B (NYSE:UHS) Seasonal Chart

Vanguard Consumer Discretionary ETF (NYSE:VCR) Seasonal Chart

Invesco DWA Consumer Cyclicals Momentum ETF (NASD:PEZ) Seasonal Chart

ProShares VIX Short-Term Futures ETF (NYSE:VIXY) Seasonal Chart

BJ’s Restaurants Inc. (NASD:BJRI) Seasonal Chart
Disclaimer: Comments and opinions offered in this report are for information only. They should not be considered as advice to purchase or to sell mentioned securities. Data offered is believed to be accurate, but is not guaranteed.
Note: With the New Year’s Day holiday on Thursday, our next report will be released on Monday, January 5th as we allow time to get our annual database refresh underway. Happy New Year to our readers!
The Markets
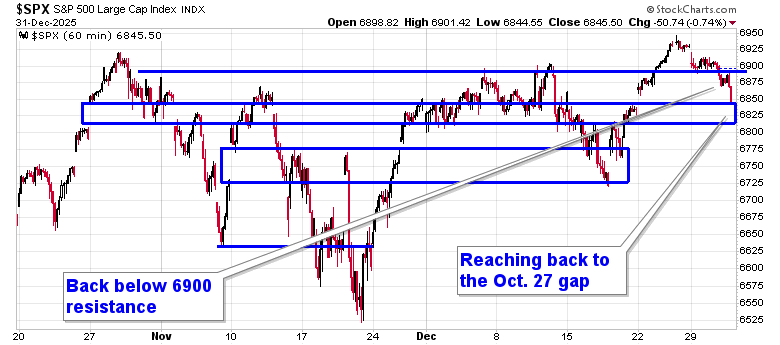
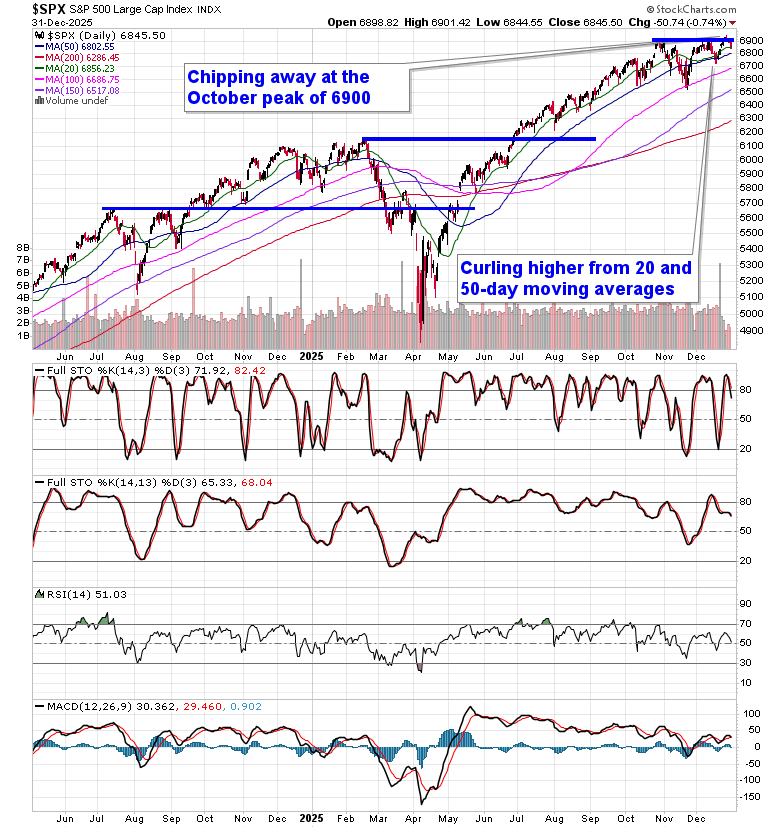
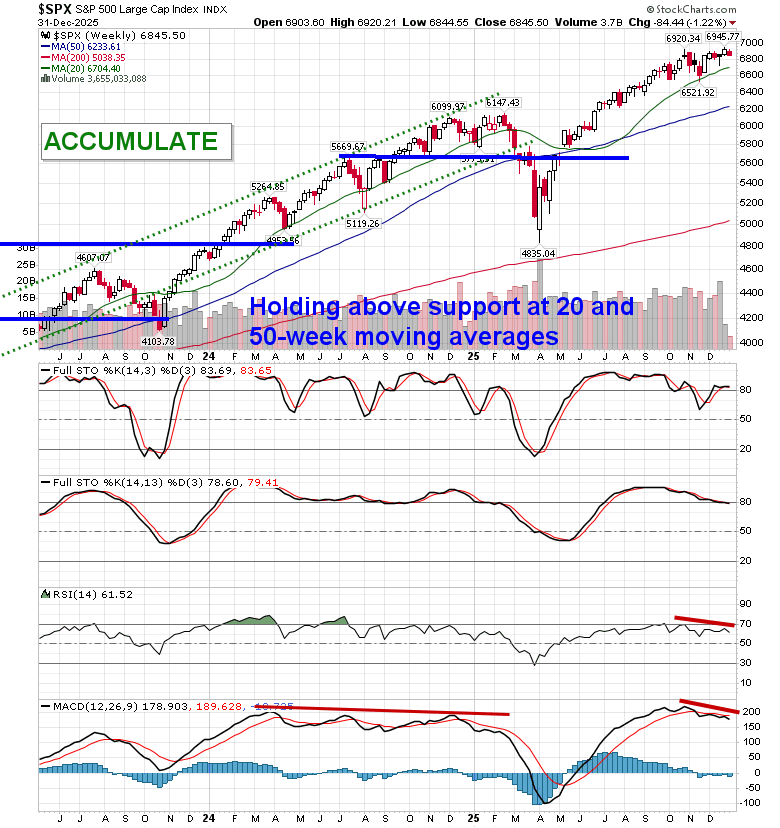
Stocks closed lower in the last session of 2025 as traders used the last minutes of the year to conduct final portfolio rebalancing trades. The S&P 500 Index declined by around three-quarters of one percent, slipping back below horizontal resistance presented by the prior 52-week closing highs around 6900. The 20-day moving average at 6856 is being tested. The benchmark remains firmly elevated above prior zones of gap resistance around 6750 and 6830, presenting plenty of leeway before a more threatening technical setup would be presented. Underlying support at major moving averages and positive year-end tendencies continue to suggest a move towards the psychologically important 7000 level, so long as the selling pressures that have filtered into the market in recent days do not continue into the first few days of the new year; traders love to pin markets and stocks into these important levels during these significant seasonal timeframes. In the Seasonal Advantage Portfolio that we oversee at Castlemoore, we remain fully invested in the equity market and the themes in our chart books to either Accumulate or Avoid have been capturing the strength that has leached into the market from the November 20th lows.
Today, in our Market Outlook to subscribers, we discuss the following:
- Monthly look at the large-cap benchmark
- The average rise in volatility to start the year
- Average tendency for stocks in January
- Securities that have gained or lost in every January over their trading history
- Best consumer buys for the month of January
- The spike in bearish sentiment during the final session of 2025
Subscribers can look for this report in their inbox or by clicking on the following link and logging in: Market Outlook for January 5
Not signed up yet? Subscribe now to receive full access to all of the research and analysis that we publish
Looking ahead, the first month of the year has historically generated strong results, when looking at data from the past five decades. The S&P 500 Index has averaged a return of 1.2% in this first month of the year, however, the frequency of gains is rather muted at 60%. Returns have ranged from a loss of 8.6% in January of 2009 to a gain of 13.2% in January of 1987. We provide more insight in our just released monthly report for January. Subscribers can look for this report in their inbox or in the archive at https://charts.equityclock.com/
Just Released…
Our monthly report for January is out, providing you with everything that you need to know to navigate the market through the month(s) ahead.
Highlights in this report include:
- Equity market tendencies in the month of January
- Tendency for stocks during mid-term election years
- Mid-Term election year tendency under a new presidential party
- Average tendencies for the economy during Mid-Term Election years
- Higher than average volatility in stocks during Mid-Term Election years
- Tendency for Yields (cost of borrowing) through the year ahead
- Dollar Index tailwind in 2026
- Emerging Markets
- Looking for Small-Cap outperformance into the start of the new year
- Loss of Tech leadership
- Bitcoin providing a fairly downbeat view of what to expect of the Technology sector early into 2026
- Rapid normalization of the Treasury Yield curve
- Gauging Credit Conditions
- Waiting to see if the liquidity injection provided by the Fed will fuel equity prices
- Degradation in the labor market
- Healthy portfolio for the New Year
- Layoffs trending above average
- Our list of all segments of the market to either Accumulate or Avoid, along with relevant ETFs
- Positioning for the months ahead
- Sector Reviews and Ratings
- Stocks that have Frequently Gained in the Month of January
- Notable Stocks and ETFs Entering their Period of Strength in January
Subscribers can look for this 110-page report in their inbox and in the report archive.
Not signed up yet? Subscribe now to receive full access to all of the research and analysis that we publish
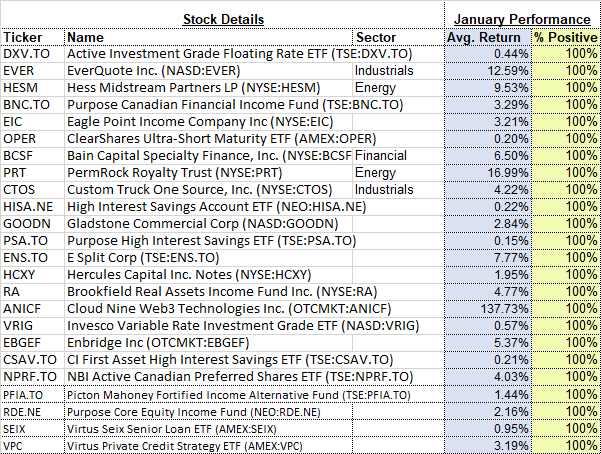
With the new month upon us and as we celebrate the release of our monthly report for January, today we release our screen of all of the stocks that have gained in every January over their trading history. While we at Equity Clock focus on a three-pronged approach (seasonal, technical, and fundamental analysis) to gain exposure to areas of the market that typically perform well over intermediate (2 to 6 months) timeframes, we know that stocks that have a 100% frequency of success for a particular month is generally of interest to those pursuing a seasonal investment strategy. Below are the results:
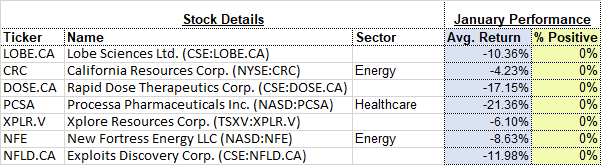
And how about those securities that have never gained in this first month of the year, here they are:
*Note: None of the results highlighted above have the 20 years of data that we like to see in order to accurately gauge the annual recurring, seasonal influences impacting an investment, therefore the reliability of the results should be questioned. We present the above list as an example of how our downloadable spreadsheet available to yearly subscribers can be filtered. For a more extensive list of high frequency (70% ) gainers for the month of January, please refer to our monthly report.
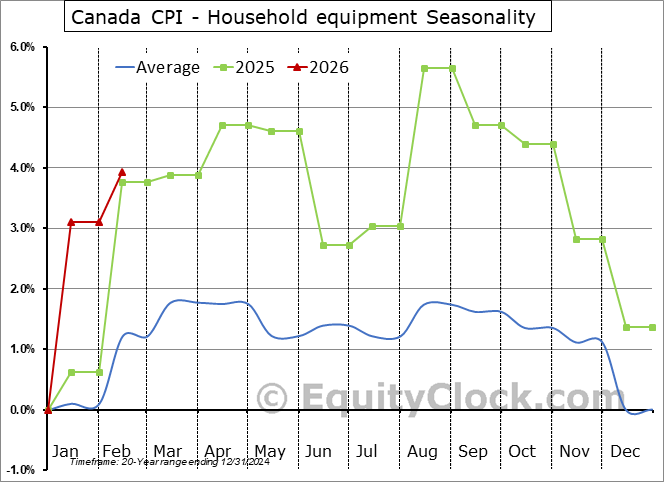
As part of a new offering to portray how seasonality can be used in everyday purchases, today we are diving into a list of categories that are ideal consumer buys in the month of January. A number of categories have ties to the markdowns of excess inventory that exist after the holiday season, as well as the incentives that retailers attempt to offer following the big shopping event at year end. Categories that consumers can seek to take advantage of in the first month of the year include:
- Holiday decor, gift wrap, toys, and leftover foods/snacks: Ornaments, artificial trees, lights, wrapping paper, toys for the Christmas, holiday chocolates/snacks, and gift sets are often 70–90% off as retailers clear Christmas inventory.
- Winter clothing & boots: Coats, sweaters, gloves, and winter footwear are marked down 40–75% as stores make room for spring lines.

- Linens and bedding: Traditional “white sales” mean sheets, duvets, pillows, and towels frequently see 50–80% discounts.
- Home fitness equipment: Treadmills, bikes, weights, mats, and resistance bands are promoted off the back of New Year’s resolutions, with discounts often up to about 60%.
- Gym memberships and fitness apparel: Many gyms and sporting‑goods chains run January promos to attract new members or clear last season’s gear.
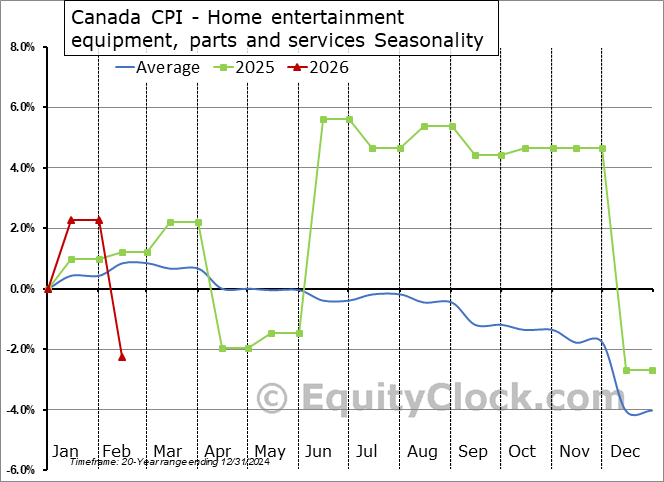
- Televisions & some electronics: TV prices tend to stay low after Boxing Day/holiday sales, with January deals tied to clearing old models before spring releases and pre‑Super‑Bowl promos.
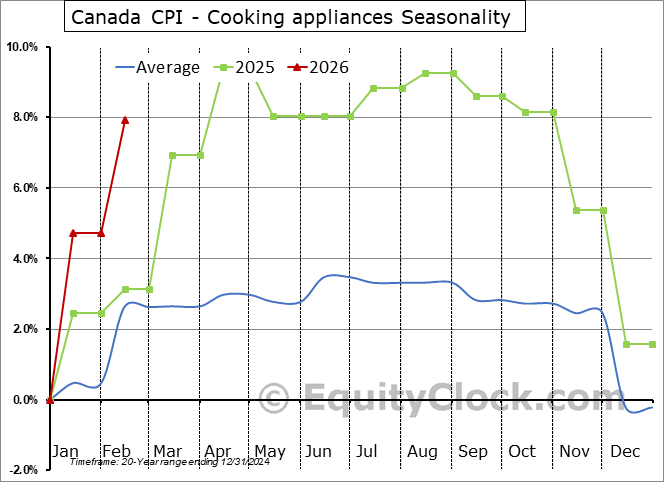
- Small kitchen appliances: Coffee makers, slow cookers, air fryers, and similar gadgets are often discounted as leftover holiday inventory is cleared.
- Select beauty and gift sets: Pre‑packaged holiday beauty sets are heavily reduced to move unsold seasonal packaging.
- Winter sport gear: Skis, snowboards, and cold‑weather apparel at sporting goods chains (Sport Chek, Sporting Life, etc.) often hit clearance in late December/January to get ready for spring stock.
- Air conditioners & servicing: Off‑season work on AC units or buying window units can be cheaper in winter, including January, when demand is low.
- Homes: A sharp drop in home sales in December and January tends to weigh on the value of homes before the big spring selling season gets underway in March

- Gasoline: While December may mark the low point in the year for the price of fuel, the price at the pumps tends to remain depressed through this colder winter month before beginning their ramp into the spring driving season

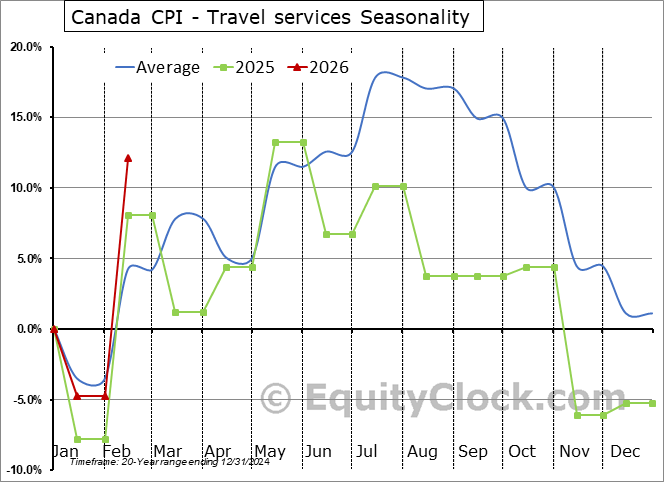
- Airline fares: As consumers focus on paying off their holiday debts, they are not looking to book airline travel after what may have been a busy travel period around the holidays. Airline fares tend to dip in December and January before ramping up again in the spring as travel season begins again.

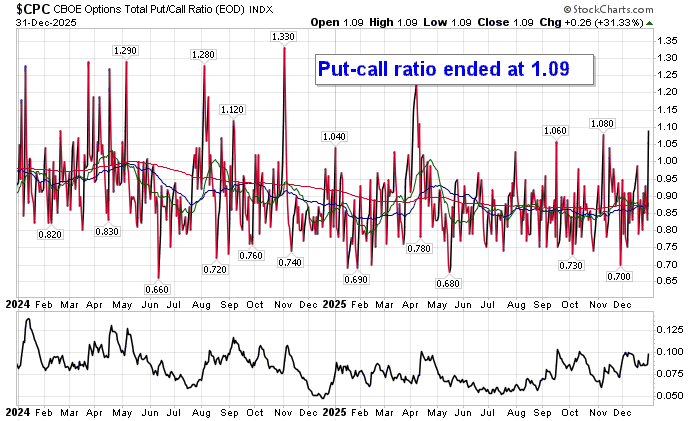
Investor sentiment on Wednesday, as gauged by the put-call ratio, ended overly bearish at 1.09.
Seasonal charts of companies reporting earnings today:
- No significant earnings scheduled for today.
S&P 500 Index
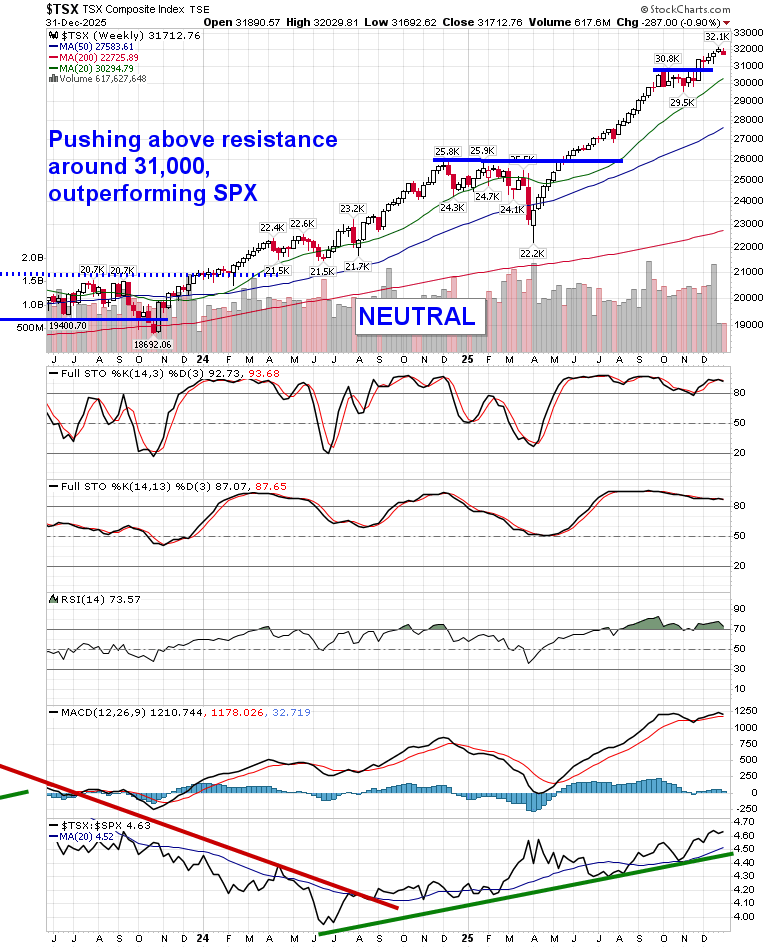
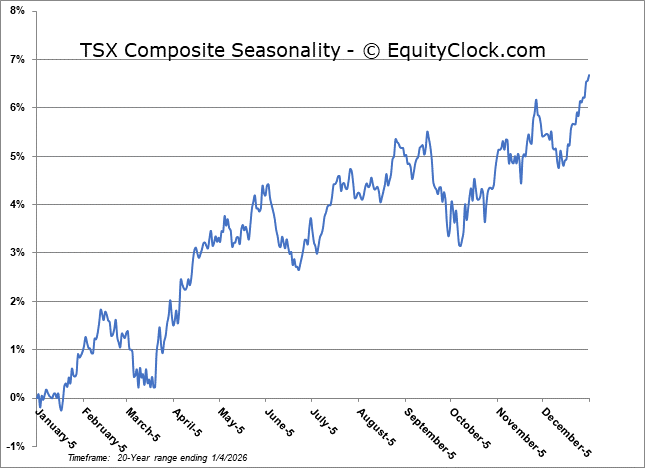
TSE Composite
| Sponsored By... |

|


