Stock Market Outlook for January 13, 2026

Broadening the Advance: Value and Cyclicals Step Into Leadership
*** Stocks highlighted are for information purposes only and should not be considered as advice to purchase or to sell mentioned securities. As always, the use of technical and fundamental analysis is encouraged in order to fine tune entry and exit points to average seasonal trends.
Stocks Entering Period of Seasonal Strength Today:
Subscribers Click on the relevant link to view the full profile. Not a subscriber? Signup here.

Nisource, Inc. (NYSE:NI) Seasonal Chart

Kirby Corp. (NYSE:KEX) Seasonal Chart

Monolithic Power Systems, Inc. (NASD:MPWR) Seasonal Chart
Disclaimer: Comments and opinions offered in this report are for information only. They should not be considered as advice to purchase or to sell mentioned securities. Data offered is believed to be accurate, but is not guaranteed.
The Markets
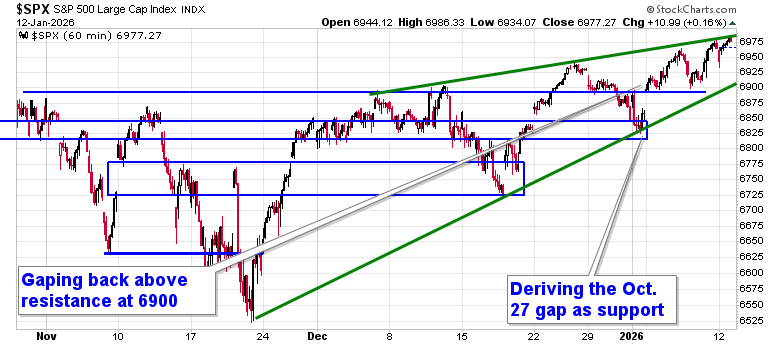
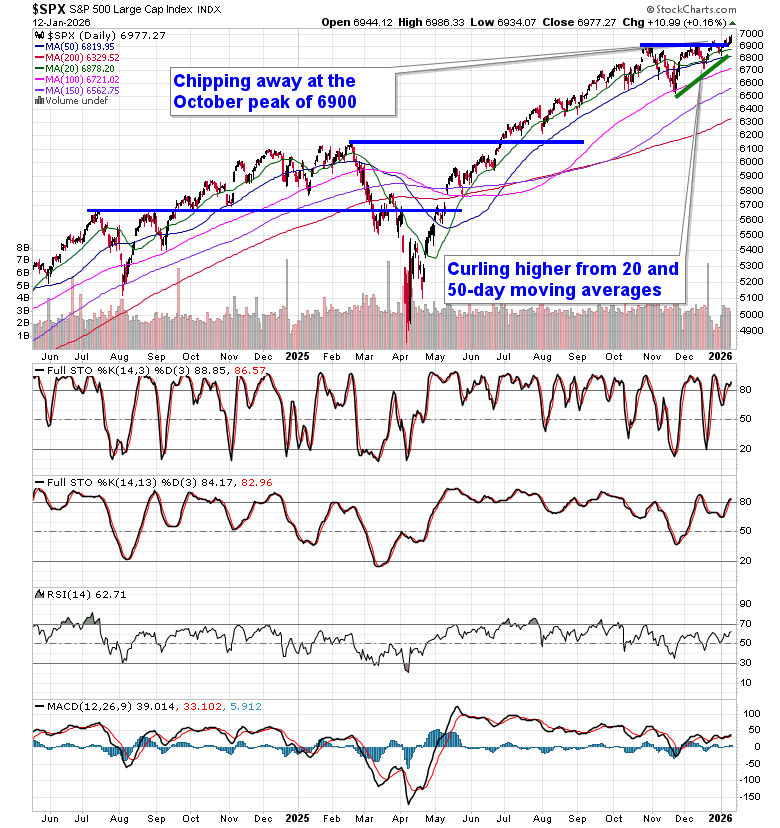
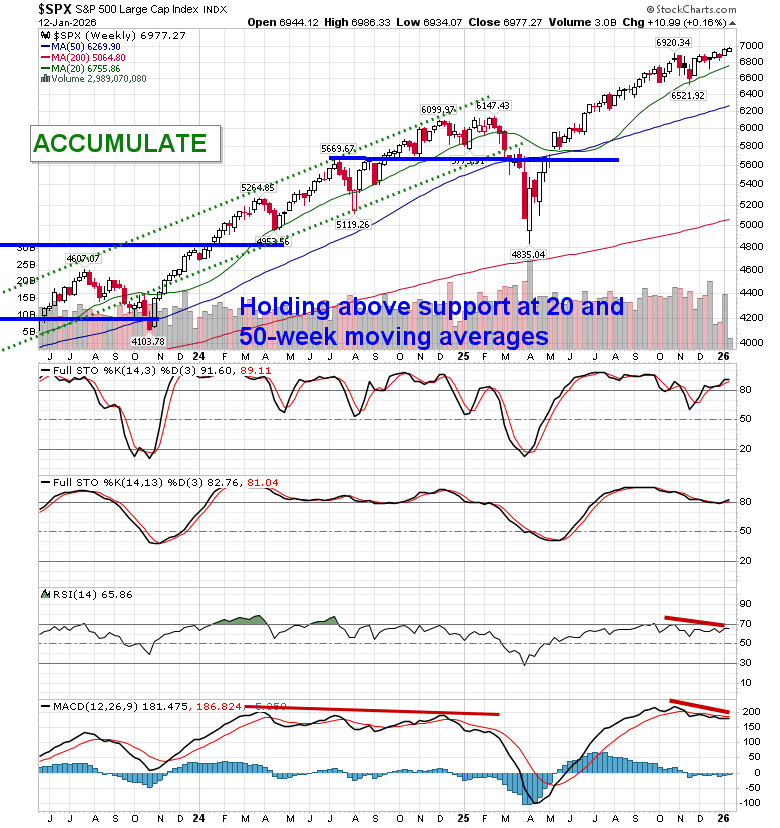
Stocks shook off concerns pertaining to news of the Federal Reserve’s independence and weakness in the Financial sector to close marginally higher on Monday. The large-cap benchmark closed with a gain of nearly two-tenths of one percent, remaining above horizontal resistance presented by the prior 52-week closing highs around 6900. End of October gap resistance continues to form new found support around 6830 and, until it is broken, playing on the long-side of this market remains appropriate. A narrowing range continues to be highlighted on the short-term chart and we continue to see reaction to the upper limit of this pattern; the lower limit can be pegged around 6905, presenting a near-term downside risk level. Ultimately, however, the narrowing span points to a culmination around the 7000 level, a psychologically important level that is presently acting as a draw. In the Seasonal Advantage Portfolio that we oversee at Castlemoore, we remain fully invested in the equity market and the themes in our chart books to either Accumulate or Avoid have been capturing the strength that has leached into the market from the November 20th lows.
Want to know which areas of the market to buy or sell? Our Weekly Chart Books have just been updated, providing a clear Accumulate, Avoid, or Neutral rating for currencies, cryptocurrencies, commodities, broad markets, and subsectors/industries of the market. Subscribers can login and click on the relevant links to access.
- Currencies
- Cryptocurrencies
- Commodities
- Major Benchmarks
- Sub-sectors / Industries
- ETFs: Bonds | Commodities | Equity Markets | Industries | Sectors
Subscribe now.
Today, in our Market Outlook to subscribers, we discuss the following:
- Market Structure & Near-Term Outlook
- Leadership Rotation: Growth → Value
- Small Caps Confirm Risk-On Behavior
- This week’s Accumulate additions and our entire list of market segments to either Accumulate or Avoid
- Industry Rating Changes
- New Avoid calls
- Other Notes providing a profile of all of the market moving dynamics and how to position around them
Subscribers can look for this report in their inbox or by clicking on the following link and logging in: Market Outlook for January 13
Not signed up yet? Subscribe now to receive full access to all of the research and analysis that we publish
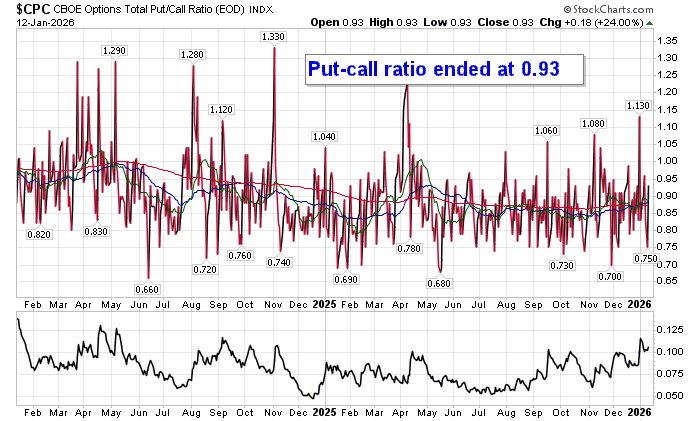
Sentiment on Monday, as gauged by the put-call ratio, ended bullish at 0.93.
Update pertaining to our annual chart database refresh: As many of you will know, we have been busy since the year started updating and rolling over all of the chart database files to incorporate data from the year just past. By now, you should notice updated charts and historical data spreadsheets for the 9000+ securities, benchmarks, commodities, and forex that we have data for. If you are still pulling up the old charts in your search, please clear the cache in your browser to force the download of the new profiles.
We have also uploaded three of the four downloadable spreadsheets (Commodities, Forex, and Industries) available to yearly subscribers with the last (Exchange Listed Securities) to be finalized through the week ahead. We continue to calculate and compile the optimal holding periods for all exchange listed securities to factor in the data from 2025 to the analysis. We expect the process to be complete and uploaded early next week, bringing a close to this annual project. These spreadsheets offer the ability to define specialized queries to identify investments of seasonal significance and we know that it is always anticipated as to the completion of the annual refresh. We will provide another update when everything is complete. As always, thank you for your patience with this regard.
Seasonal charts of companies reporting earnings today:


S&P 500 Index

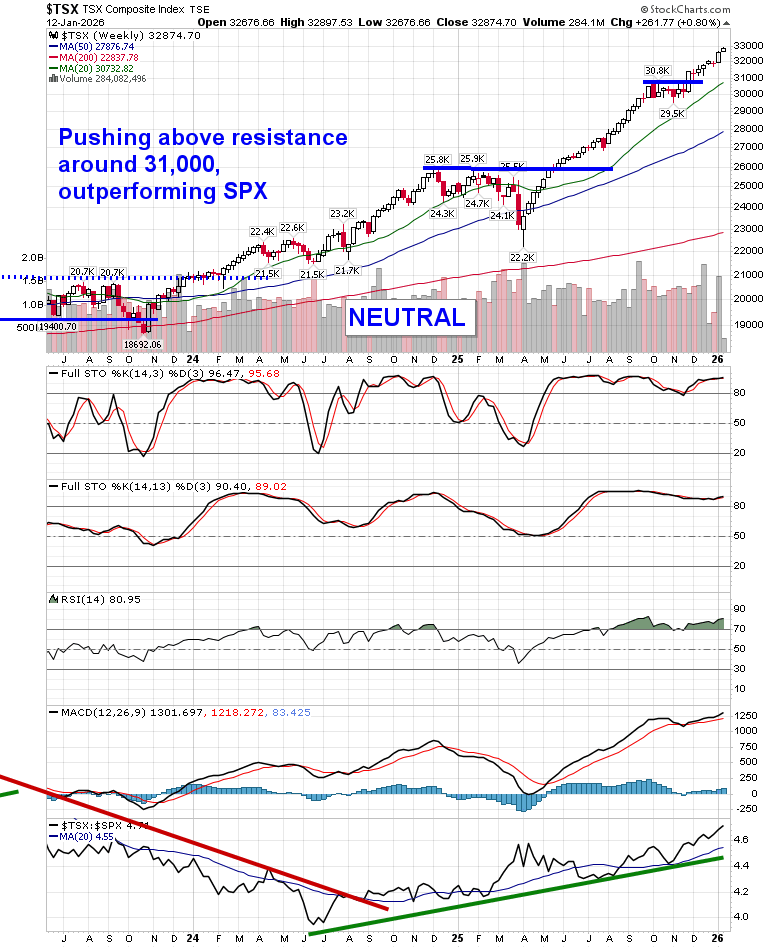
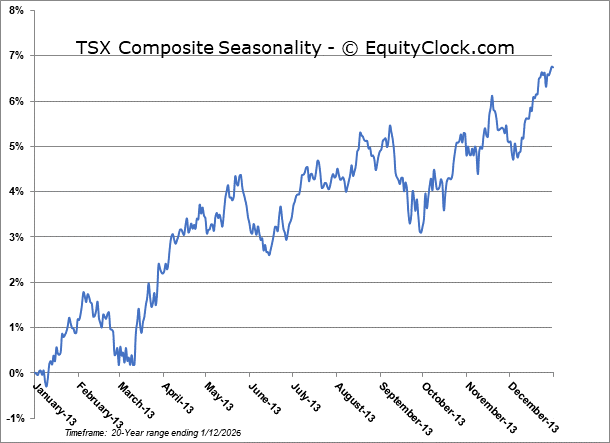
TSE Composite
| Sponsored By... |

|


