Stock Market Outlook for January 21, 2026

Bracing for the kind of volatility that is average around this time of year.
*** Stocks highlighted are for information purposes only and should not be considered as advice to purchase or to sell mentioned securities. As always, the use of technical and fundamental analysis is encouraged in order to fine tune entry and exit points to average seasonal trends.
Stocks Entering Period of Seasonal Strength Today:
Subscribers Click on the relevant link to view the full profile. Not a subscriber? Signup here.
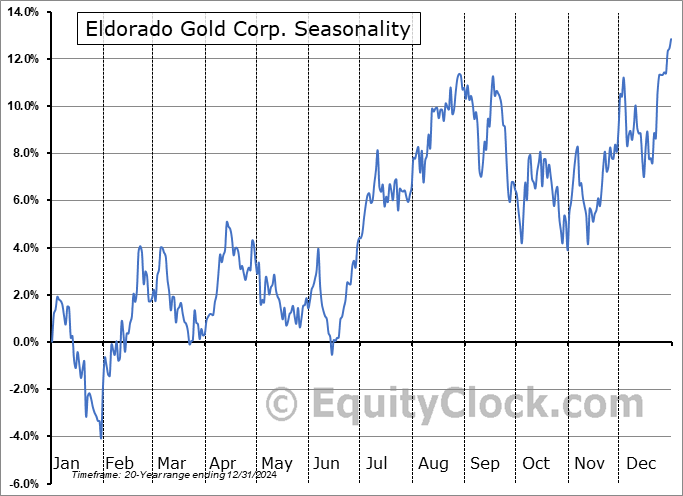
Eldorado Gold Corp. (TSE:ELD.TO) Seasonal Chart

Toromont Industries Ltd. (TSE:TIH.TO) Seasonal Chart

Stella-Jones, Inc. (TSE:SJ.TO) Seasonal Chart

Weis Markets, Inc. (NYSE:WMK) Seasonal Chart

iShares Diversified Monthly Income ETF (TSE:XTR.TO) Seasonal Chart

Corporate Office Properties Trust, LP (NYSE:CDP) Seasonal Chart
Disclaimer: Comments and opinions offered in this report are for information only. They should not be considered as advice to purchase or to sell mentioned securities. Data offered is believed to be accurate, but is not guaranteed.
The Markets
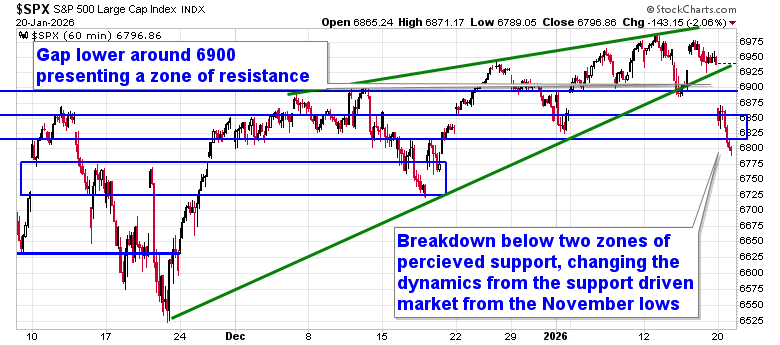
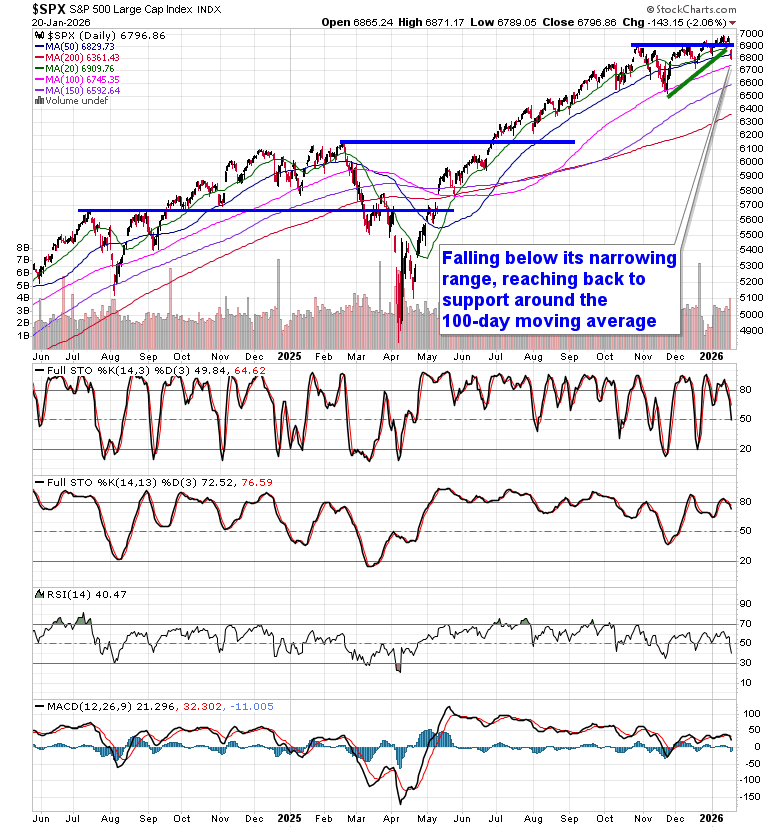
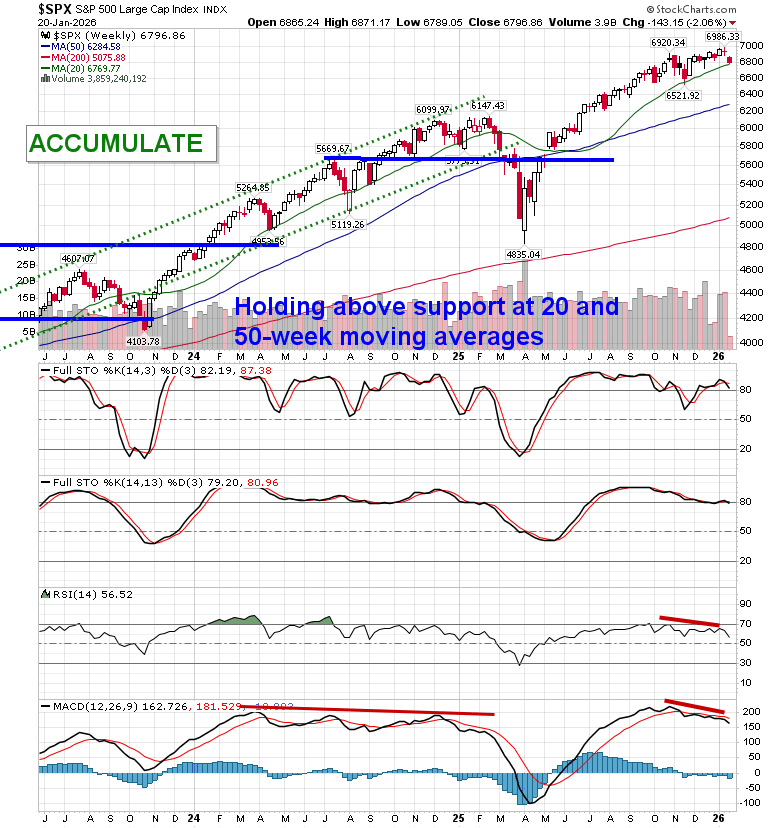
Stocks sold off sharply on Tuesday as the rise of geopolitical tensions amidst a re-escalation of tariff rhetoric had investors looking to de-risk. The S&P 500 Index closed down by just over two percent, breaking below the prior 52-week closing highs around 6900, as well as the end of October gap resistance turned support around 6830. The narrowing range that we have been profiling for the past month has been broken. A downside gap around 6900 applies a level of resistance to scrutinize through the days ahead. Our triggers that we have spelled out to trim equity exposure have been hit, but there is little desire to participate in selling into a panic. Prior to Tuesday’s session, the market was showing greater respect to levels of support than to levels of resistance, but Tuesday’s price action threatens to flip this stance. A recovery into the aforementioned zone of gap resistance (~6900) through the days/weeks ahead that gets sold into would provide the more opportune time to lighten up on equity exposure, bracing for the kind of volatility that is average around this time of year. For now, we know that Trump’s negotiating style is to always reach for the most aggressive ask, only to tamper down rhetoric to achieve an outcome that is aligned with what was desired in the first place, creating these ebbs and flows in the equity market where panic selling during the initial blow is typically not appropriate and staying disciplined to a process remains prudent. In the Seasonal Advantage Portfolio that we oversee at Castlemoore, after enacting trades last week to reduce sensitivity to growth (Technology) segments of the market, there were no trades that were considered to be required on Tuesday. We continue to tailor towards the themes in our chart books to either Accumulate or Avoid that have been capturing the strength and rotation that has filtered into the market from the November 20th lows.
Want to know which areas of the market to buy or sell? Our Weekly Chart Books have just been updated, providing a clear Accumulate, Avoid, or Neutral rating for currencies, cryptocurrencies, commodities, broad markets, and subsectors/industries of the market. Subscribers can login and click on the relevant links to access.
- Currencies
- Cryptocurrencies
- Commodities
- Major Benchmarks
- Sub-sectors / Industries
- ETFs: Bonds | Commodities | Equity Markets | Industries | Sectors
Subscribe now.
Today, in our Market Outlook to subscribers, we discuss the following:
- Market Action & Technical Breakdown
- Risk Management & Tactical Stance
- Macro & Volatility Backdrop
- Leadership Rotation: Growth to Value
- Commodities as a Hedge
- Accumulate: New Opportunities
- Rating changes in our chart books
- Our list of all segments of the market to either Accumulate or Avoid
- Other Notes
Subscribers can look for this report in their inbox or by clicking on the following link and logging in: Market Outlook for January 21
Not signed up yet? Subscribe now to receive full access to all of the research and analysis that we publish
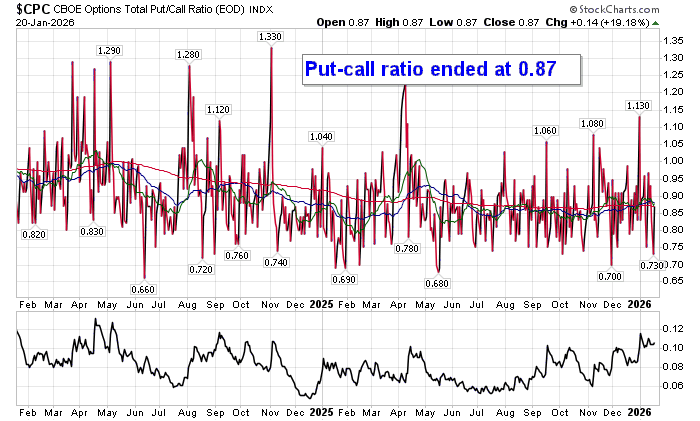
Sentiment on Tuesday, as gauged by the put-call ratio, ended bullish at 0.87.
Seasonal charts of companies reporting earnings today:


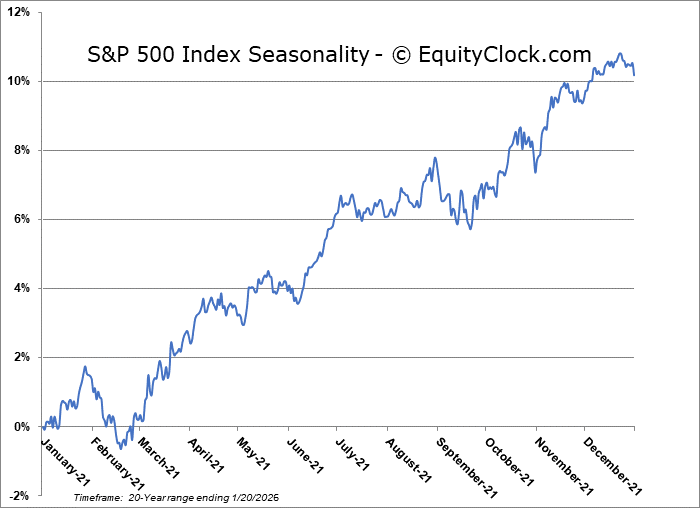
S&P 500 Index
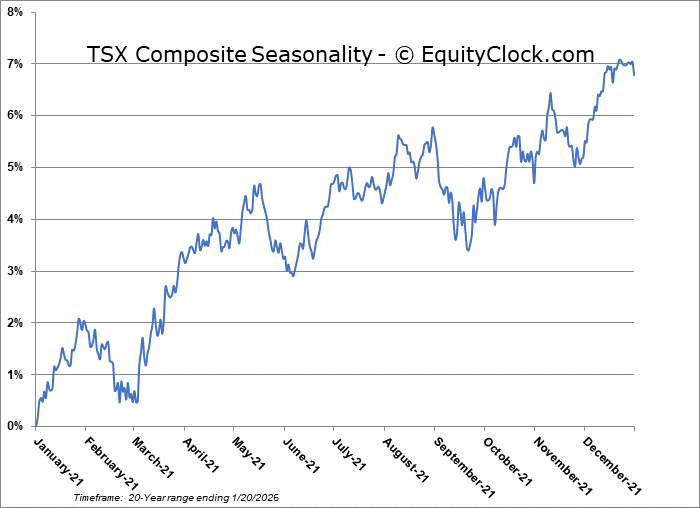
TSE Composite
| Sponsored By... |

|


