Stock Market Outlook for February 2, 2026

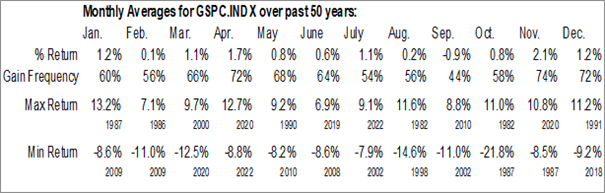
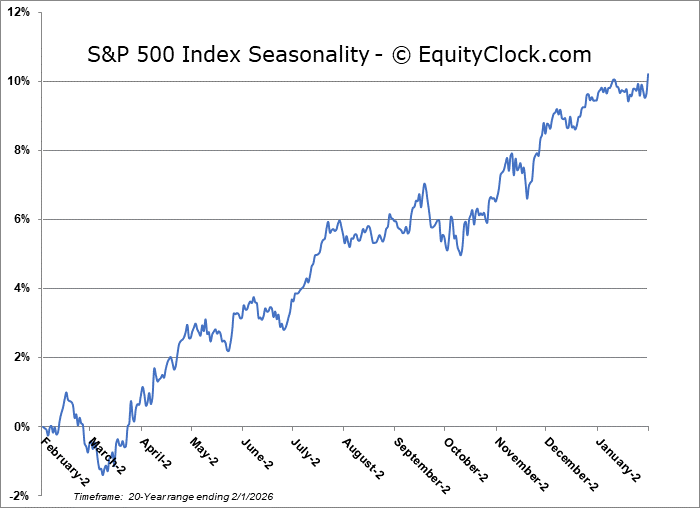
Over the past five decades, the S&P 500 Index has been unchanged, on average, in February with the frequency of positive results equally unimpressive at 54%.
*** Stocks highlighted are for information purposes only and should not be considered as advice to purchase or to sell mentioned securities. As always, the use of technical and fundamental analysis is encouraged in order to fine tune entry and exit points to average seasonal trends.
Stocks Entering Period of Seasonal Strength Today:
Subscribers Click on the relevant link to view the full profile. Not a subscriber? Signup here.

WW Grainger, Inc. (NYSE:GWW) Seasonal Chart

Tourmaline Oil Corp. (TSE:TOU.TO) Seasonal Chart

Invesco DB Oil Fund (NYSE:DBO) Seasonal Chart

iShrs Core MSCI US Quality Dividend Index ETF (TSE:XDU.TO) Seasonal Chart

SPDR S&P Emerging Asia Pacific ETF (NYSE:GMF) Seasonal Chart

iShares U.S. Consumer Staples ETF (NYSE:IYK) Seasonal Chart
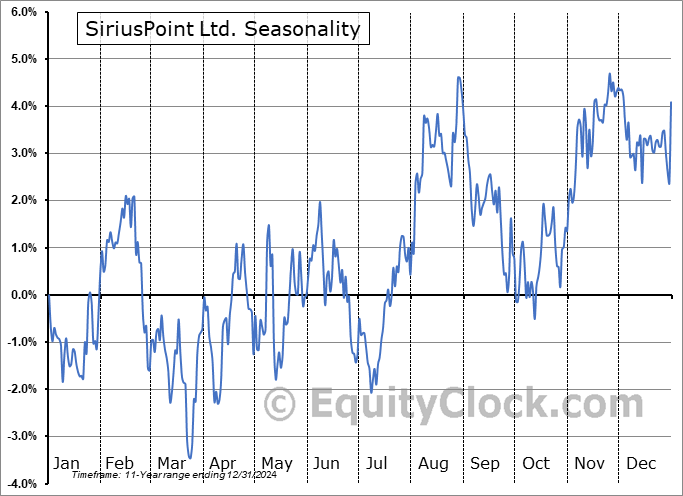
SiriusPoint Ltd. (NYSE:SPNT) Seasonal Chart

International Seaways, Inc. (NYSE:INSW) Seasonal Chart

BMO Low Volatility US Equity Hedged to CAD ETF (TSE:ZLH.TO) Seasonal Chart

iShares U.S. High Dividend Equity Index ETF (TSE:XHU.TO) Seasonal Chart
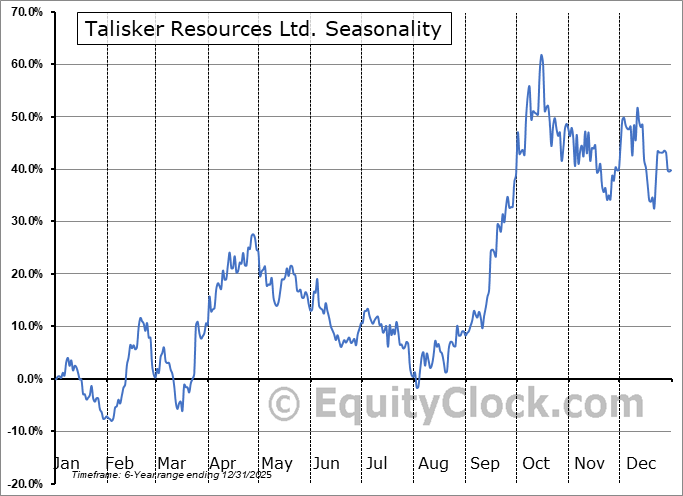
Talisker Resources Ltd. (TSE:TSK.TO) Seasonal Chart

Baytex Energy Corp. (TSE:BTE.TO) Seasonal Chart

Yum! Brands Inc. (NYSE:YUM) Seasonal Chart
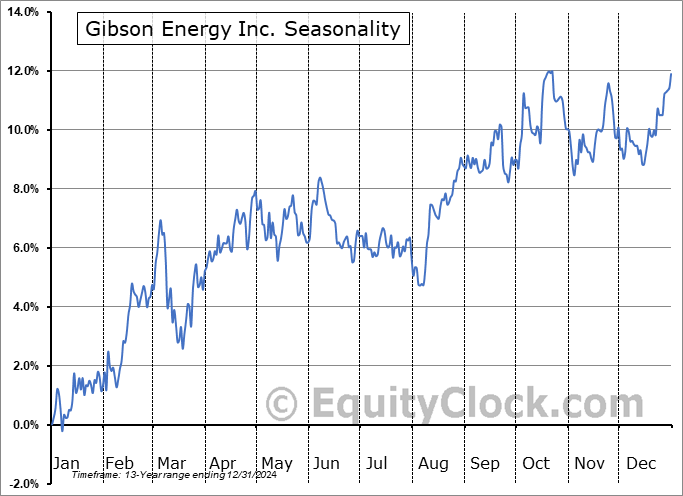
Gibson Energy Inc. (TSE:GEI.TO) Seasonal Chart

WisdomTree Global High Dividend Fund (NYSE:DEW) Seasonal Chart
Disclaimer: Comments and opinions offered in this report are for information only. They should not be considered as advice to purchase or to sell mentioned securities. Data offered is believed to be accurate, but is not guaranteed.
The Markets
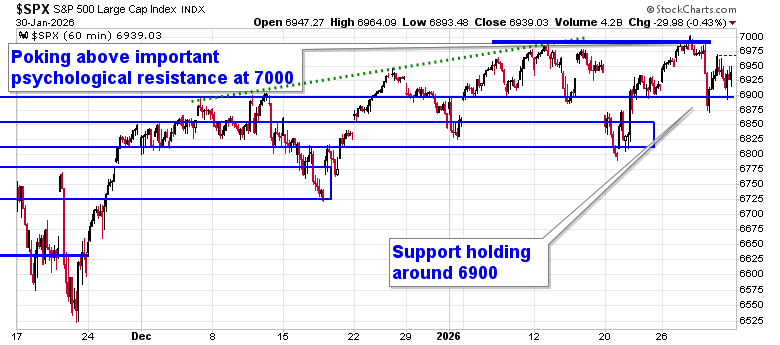
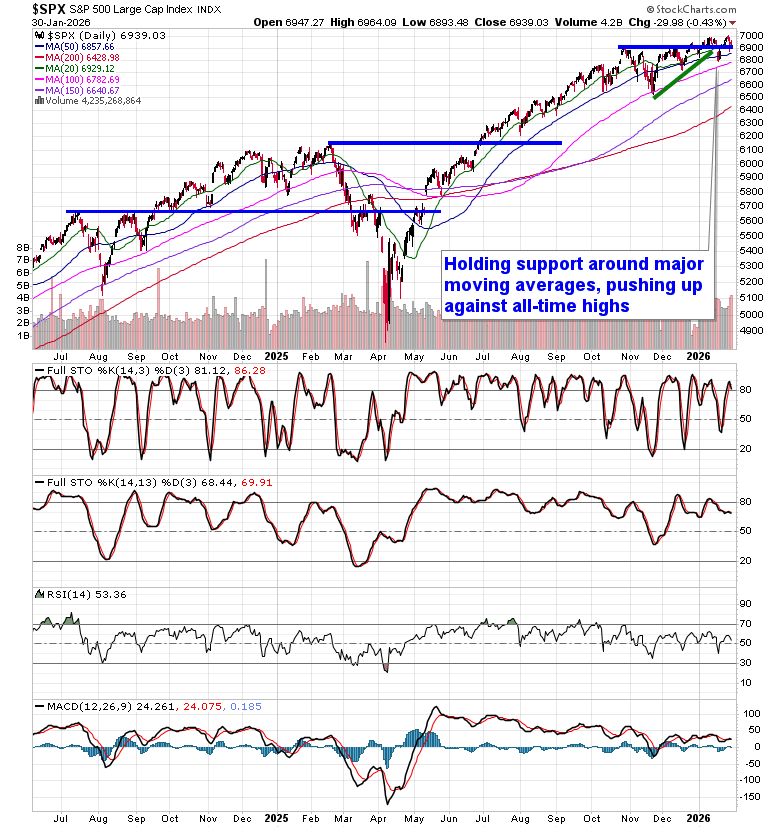
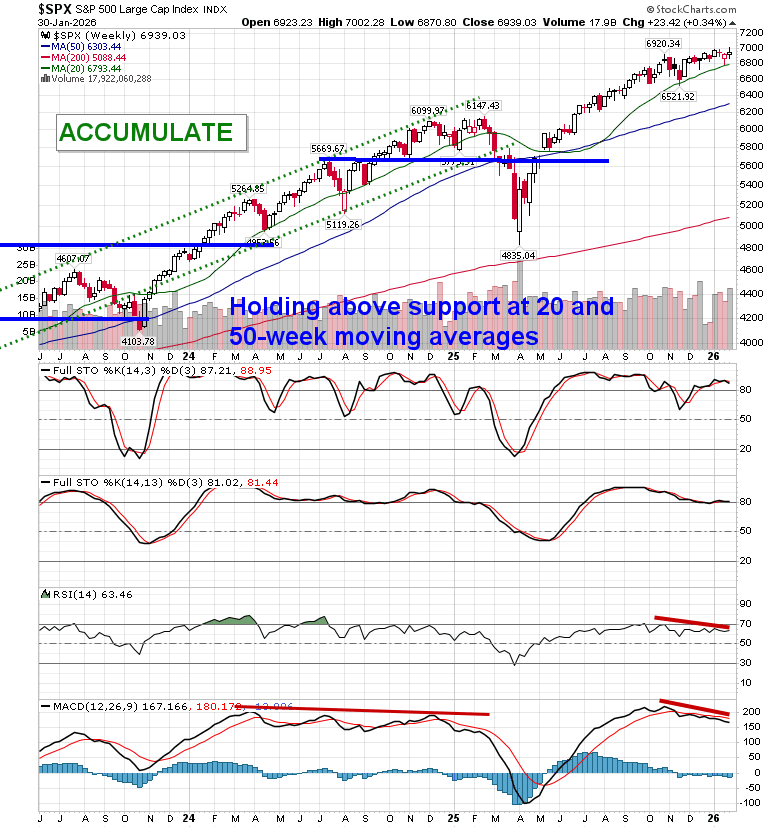
A pop of the bubble in the precious metal market following the announcement of the new Fed chair nominee had traders trimming equity positions ahead of the close of the month. The S&P 500 Index closed down by just over four-tenths of one percent, pulling back from the all-time intraday high achieved on Wednesday around 7000; the market is highlighting the importance of this level of psychological resistance, presenting the risk of revealing a double-top. Short-term support around 6900 remains intact, defining more of a trading range between this and the aforementioned all-time peak. Previous October gap resistance turned support around 6830 has been keeping us engaged with equity exposure until definitively broken. We remain on the lookout for a potential shift of the market’s character ahead where levels of resistance hold greater weight than support and, while the very recent price action has provided hints of this, nothing definitive has been revealed yet to shake us loose of our equity exposure; should a topping pattern become confirmed, looking to trim equity exposure will become prudent, bracing for the kind of volatility that is average around this time of year. When it comes to the price action at the very end of the month, the moves must be definitive, looking past the noise attributed to end of month trading. In the Seasonal Advantage Portfolio that we oversee at CastleMoore, there have been no trades that have been considered to be required and we continue to benefit from our pro-cyclical and commodity oriented stance (many of which were positive last week, overall). We continue to tailor towards the themes in our chart books to either Accumulate or Avoid that have been capturing the strength and rotation that has filtered into the market from the November 20th lows.
Today, in our Market Outlook to subscribers, we discuss the following:
- Market Action & Key Technical Levels
- Big Picture Trend: Still Bullish, but Stretched
- “As Goes January” – With Caveats
- February Seasonality & Volatility Risk
- Securities that have gained or lost in every February
- Precious Metals: Bubble Deflates, Trend Intact
- Commodity Leadership & Cyclical Rotation
Subscribers can look for this report in their inbox or by clicking on the following link and logging in: Market Outlook for February 2
Not signed up yet? Subscribe now to receive full access to all of the research and analysis that we publish
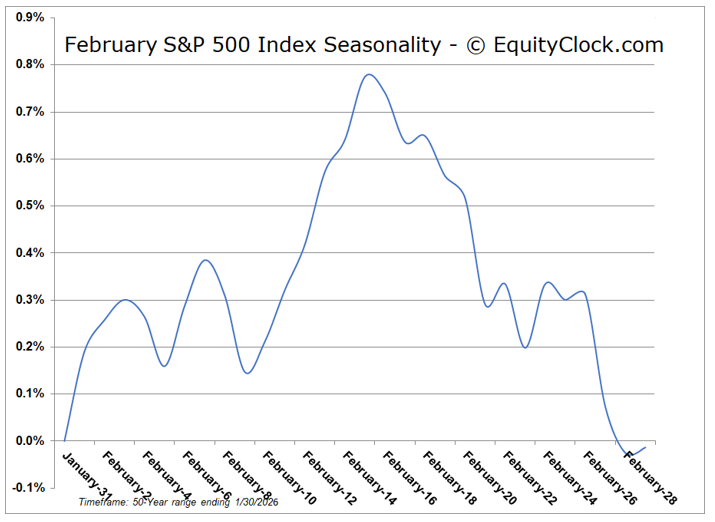
The month of February has historically been lacklustre for stocks. The S&P 500 Index has been unchanged on average, in this second month of the year over the past five decades with the frequency of positive results equally unimpressive at 54%. Returns have ranged from a loss of 11.0% in February of 2009 to a gain of 7.1% in February of 1986. The average pattern for the month shows that the market tends to gain in the first couple of weeks of the period then decline in the last couple of weeks. Through the first 16 calendar days of February, the S&P 500 Index has gained an average of 0.73% with 62% of periods showing positive results, while the rest of the month has averaged a loss of 0.75% with only 42% of periods showing gains. Typically, by the middle of February, the vast majority of earnings reports have been released and the vacuum of fundamental catalysts leads to the drift lower in stocks. We break down what to focus on in the month(s) ahead in our just released Monthly Outlook for February. Subscribe now
Just Released…
Our monthly report for February is out, providing you with everything that you need to know to navigate the market through the month(s) ahead.
Highlights in this report include:
- Equity market tendencies in the month of February
- Playing the market with a pro-cyclical bent
- Using Copper as a gauge of the health of the (industrial) economy for the year ahead
- The warning being presented from the uptick in the cost of borrowing
- The fragile state of loan activity
- Construction spending struggling amidst the high cost of borrowing, but trading opportunities persist
- Strongest calendar-year increase in industrial production since 2021
- Looking for the Energy sector stocks that frequently gain in February and March
- Bitcoin as a leading indication of equity market performance
- Value over Growth
- Bifurcated Technology sector dynamics
- Long China Tech, Short Domestic Tech
- Strong Small-caps performance during the period of seasonal strength with one month left in the timeline
- Downside risks to stocks in this mid-term election year
- Our list of all segments of the market to either Accumulate or Avoid, along with relevant ETFs
- Positioning for the months ahead
- Sector Reviews and Ratings
- Stocks that have Frequently Gained in the Month of February
- Notable Stocks and ETFs Entering their Period of Strength in February
Subscribers can look for this 117-page report in their inbox and in the report archive.
Not signed up yet? Subscribe now to receive full access to all of the research and analysis that we publish
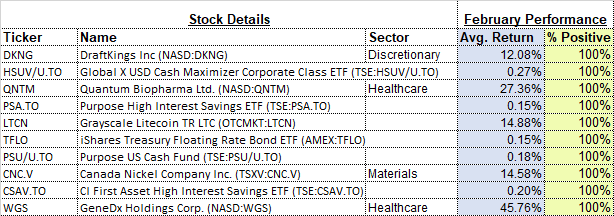
With the new month upon us and as we celebrate the release of our monthly report for February, today we release our screen of all of the stocks that have gained in every February over their trading history. While we at Equity Clock focus on a three-pronged approach (seasonal, technical, and fundamental analysis) to gain exposure to areas of the market that typically perform well over intermediate (2 to 6 months) timeframes, we know that stocks that have a 100% frequency of success for a particular month is generally of interest to those pursuing a seasonal investment strategy. Below are the results:
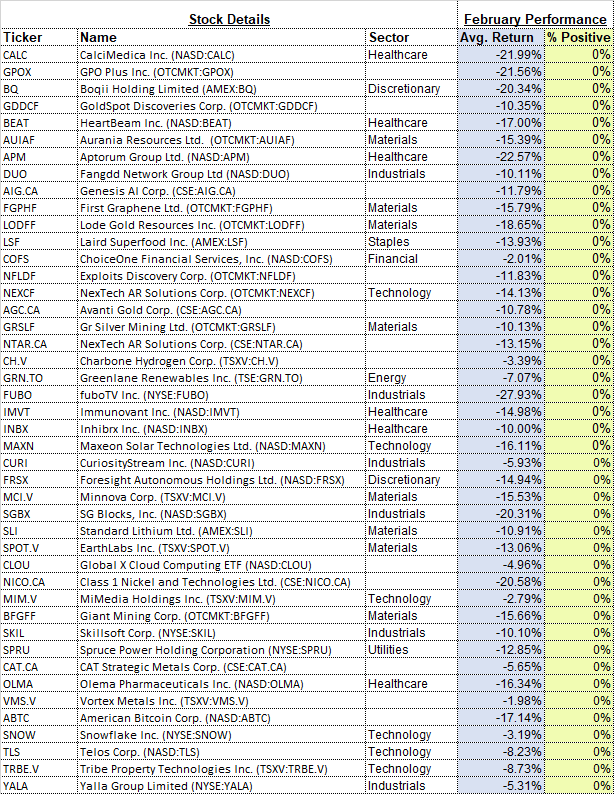
And how about those securities that have never gained in this second month of the year, here they are:
*Note: None of the results highlighted above have the 20 years of data that we like to see in order to accurately gauge the annual recurring, seasonal influences impacting an investment, therefore the reliability of the results should be questioned. We present the above list as an example of how our downloadable spreadsheet available to yearly subscribers can be filtered. For a more extensive list of high frequency (70% ) gainers for the month of February, please refer to our monthly report.
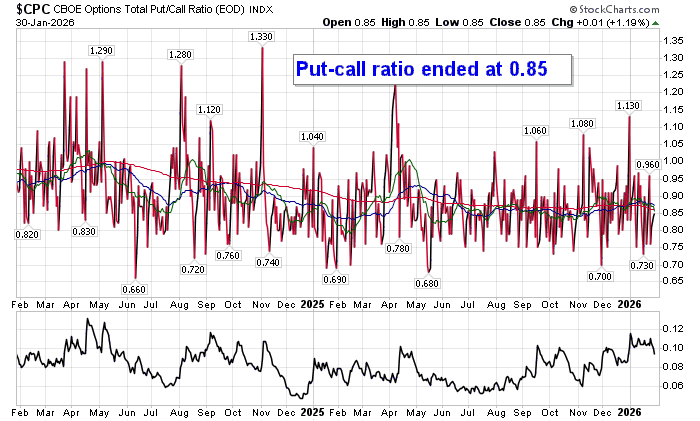
Investor sentiment on Friday, as gauged by the put-call ratio, ended bullish at 0.85.
Seasonal charts of companies reporting earnings today:


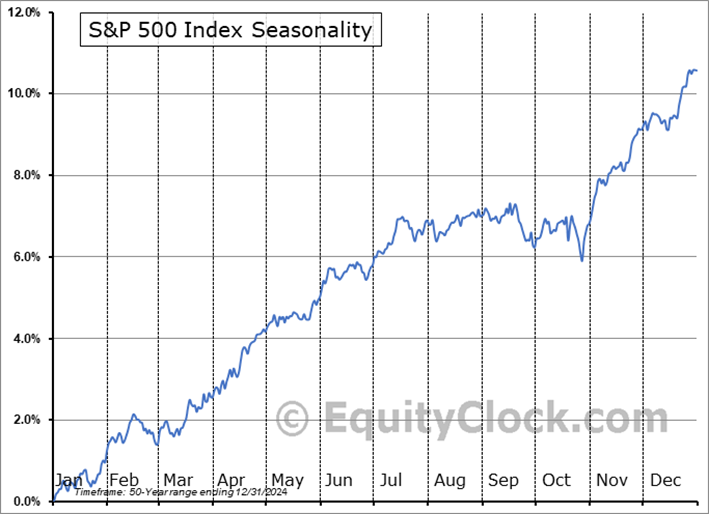
S&P 500 Index
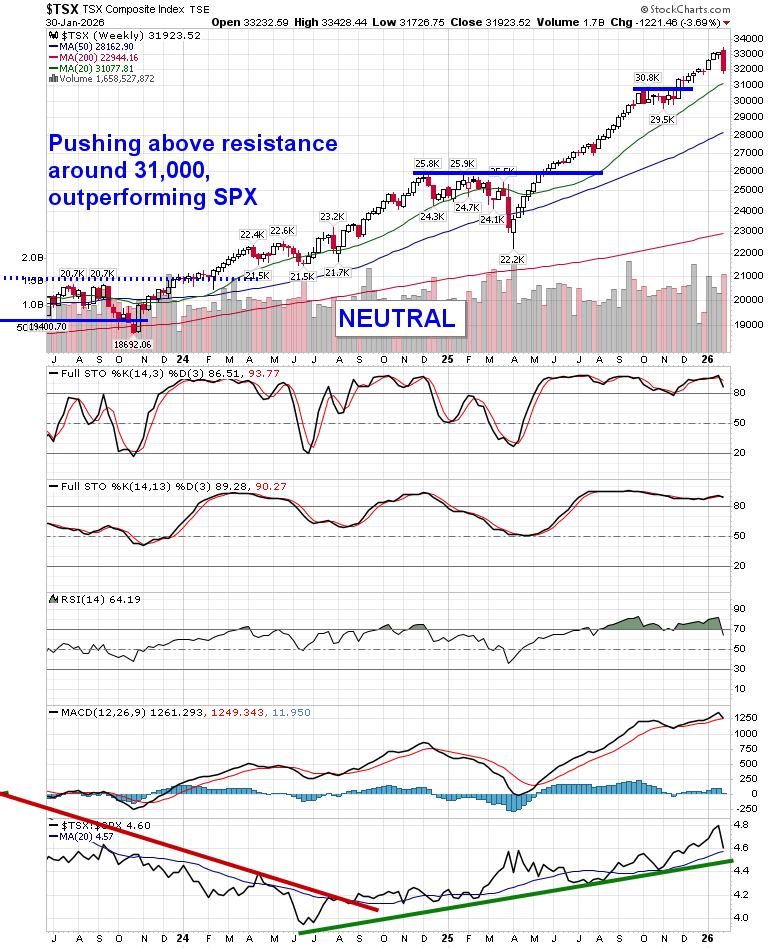
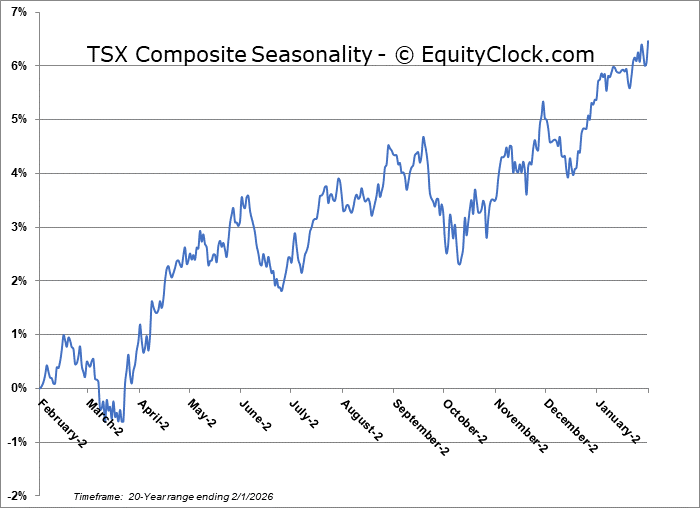
TSE Composite
| Sponsored By... |

|


